
Before we start analyzing gold, let’s see how two precious metals behave in comparison on the chart below.
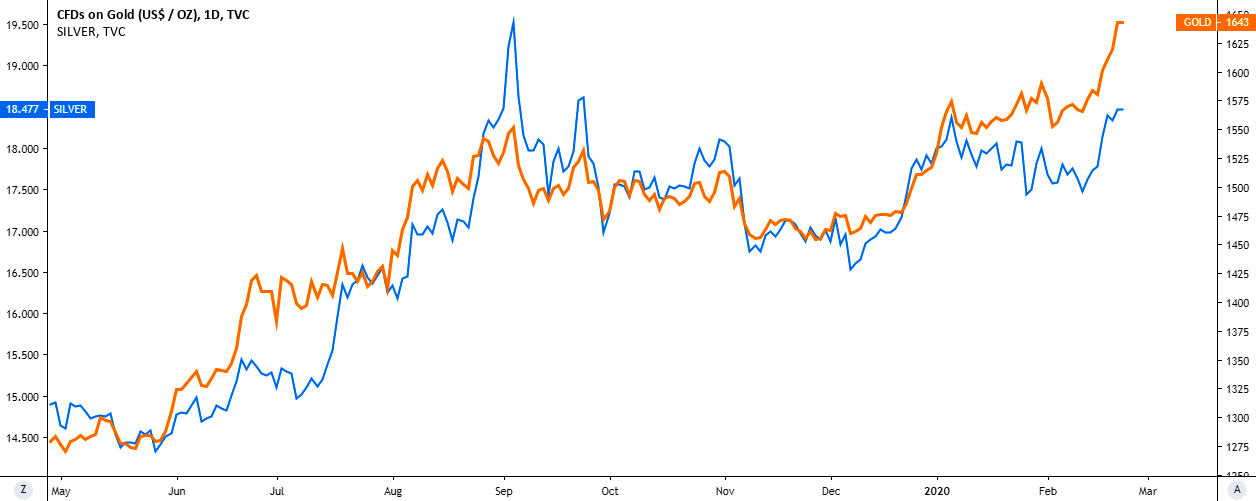
Chart courtesy of tradingview.com Gold (orange, right scale), Silver (blue, left scale)
This chart above starts from the bottom area of 2019. The most of the time, the yellow metal leads the game as Silver follows suit showing sharp moves to catch up with the gold. Sometimes the laggard throws over the leading trend amid excessive market reaction to the big moves of the top metal. Such extremes are rare and quickly get normalized by market “whales.” From this perspective, there is nothing new we can find on the chart.
I built this comparison chart to illustrate the recent divergence between these two metals as gold managed to hit the 7-year maximum while Silver was unable not only to break above the September 2019 peak but also the recent top, that was established this January at $18.85.
This could be a double-edged sword as sometimes silver acts as a leading indicator, and in this case, it means a possible weakness ahead for precious metals, or in contrast, it could show the path for a laggard to the upside to catch up with the rallying gold.
Now let’s get down to the shining metal. It’s worth seeing how did you bet on gold price last time.
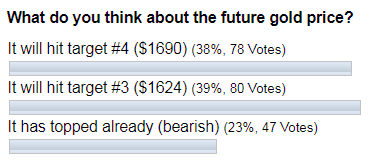
The vast majority of your votes were bullish last month, with 77% of total bets. The target #3 ($1624) that was hit last week gained the most votes, but with a very thin margin over the next popular option of target #4 ($1690).
I updated the gold chart for you below and switched to a daily time frame.
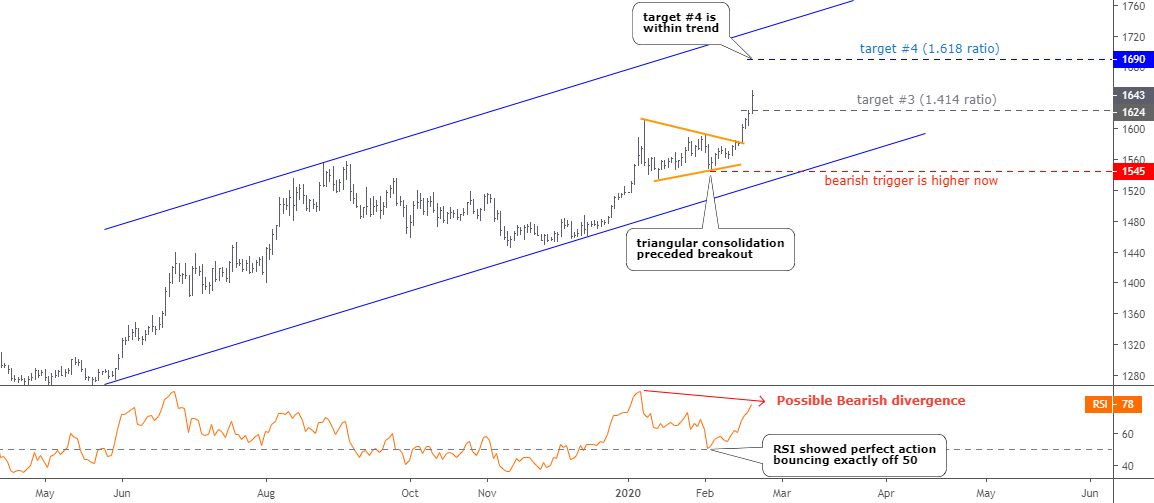
Chart courtesy of tradingview.com
The target #3 was hit last Thursday after the price broke out of the triangular consolidation (orange). This path was shown a month ago with a green zigzag in my previous post as it amazingly came true now. It is worth to note that RSI showed just perfect action as it bounced exactly off the 50 level when the price completed the triangular consolidation and rallied to the upside.
I built the blue uptrend through the valleys of May and December of 2019. The support of it was shown on the weekly chart in my previous post. The next target #4 ($1690) is located within this trend channel, as the upside of it is in the area of $1720. The gold price is almost at the halfway between target #3 and target #4.
There is another warning signal besides that one mentioned above about the relative weakness of Silver. Look at the RSI sub-chart, and you could notice that the indicator didn’t confirm the higher top on the price chart. There a potential Bearish Divergence is building on the RSI. It was detected on the monthly chart and weekly chart earlier, now it is on the daily chart. One should be careful, though.
The bearish trigger is higher now at $1545 as we got another consolidation completed ahead of the recent rally.
I want to share one more chart with you. I switched to a lower 4-hour time frame for one good reason. Let’s see below.
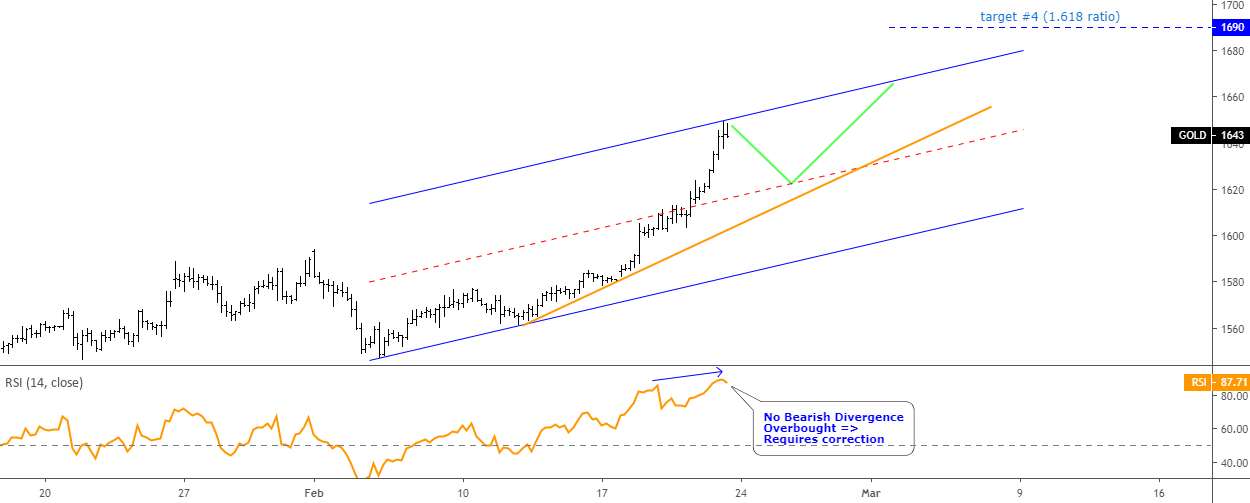
Chart courtesy of tradingview.com
As I said above, we found warning signals of Bearish Divergence on the monthly, weekly, and now on the daily time frame. That is why I switched to a lower time frame to find out if we can detect the same signal there as it looks like a nesting doll when we shift between time frames.
As you can see above, there is no Bearish divergence on it. It means that there is still a chance for more upside for the gold. But the RSI is extremely overbought as it’s reading is almost at 90 and the correction should follow soon.
I applied the same technique here as it was used on the weekly chart last month, building the blue trend channel. The red dashed mid-channel and the orange trendline support are also here. It should contain the expected correction on the downside at $1620. The green zigzag shows the potential path of the upcoming move. The RSI should get relaxed before another rally appears.
The target #4 at $1690 looks distant here as the upside of the channel is located below it between $1660 and $1670.
Intelligent trades!
Aibek Burabayev
INO.com Contributor, Metals
Disclosure: This contributor has no positions in any stocks mentioned in this article. This article is the opinion of the contributor themselves. The above is a matter of opinion provided for general information purposes only and is not intended as investment advice. This contributor is not receiving compensation (other than from INO.com) for their opinion.