Chart For Profit: Buy Gold, Sell Euro

Aibek Burabayev - INO.com Contributor - Metals


Dear INO.com readers,

This week I prepared for you an analysis of gold versus the euro and why it might be profitable choice.

My last post was also dedicated to the European cross of gold versus the Swedish krona and, for the time being, it managed to gain more than 200 SEK per troy ounce (already or more than 2%). The target is set for a 14% gain, so please be patient.

Today I am going to tell you about a chance to score a nice 18%. The chart above is a monthly candle graph of XAUEUR for the last 5 years. It was me who wrongly forgot about such a liquid metal cross with such an interesting chart pattern being shaped. But fortunately, today we still have a chance to buy gold versus euro. Continue reading "Chart For Profit: Buy Gold, Sell Euro"

Gold Versus Top Currencies! And The Winner Is….

Aibek Burabayev - INO.com Contributor - Metals


Long ago, Gold was an exchange medium and one of the very first hard currencies. In this post, I will show you YTD results of the competition between this former currency and the top 7 modern currencies. I selected the US dollar first, and the others are 6 components of US dollar index placed by weight: EUR, JPY, GBP, CAD, SEK and CHF. I bet some of you never even thought about such currency crosses for Gold.

On the above diagram, you’ll see DXY components in different extents. They lost their value against Gold and only the 'king currency' managed to survive and even gain a small profit. So the winner is US dollar and the top loser is Swedish krona, the net difference between them is 20%, impressive! Continue reading "Gold Versus Top Currencies! And The Winner Is…."

Gold/Silver Ratio Is Going To Hit 109, Are You Ready?

Aibek Burabayev - INO.com Contributor - Metals


The gold-silver ratio was in a downtrend for 10 years, falling from the hard-to-imagine 1991 level's high of 100, to the 1998 local low at the 46 level. The ratio then shaped a reversal double bottom pattern and the price started to elevate firmly after it managed to pass the pattern's neckline at the 60 level. Later, the ratio came up to very strong resistance of the downtrend, which kept the price below resistance from six previous bullish attacks. The price tried its 7th attempt, but failed and only at the end of 2001 it managed to break up the trend. The ratio spent another year in consolidation and then rocketed above the 75 level, reaching 1990 and 1996 peaks.

gold-silver ratio chart

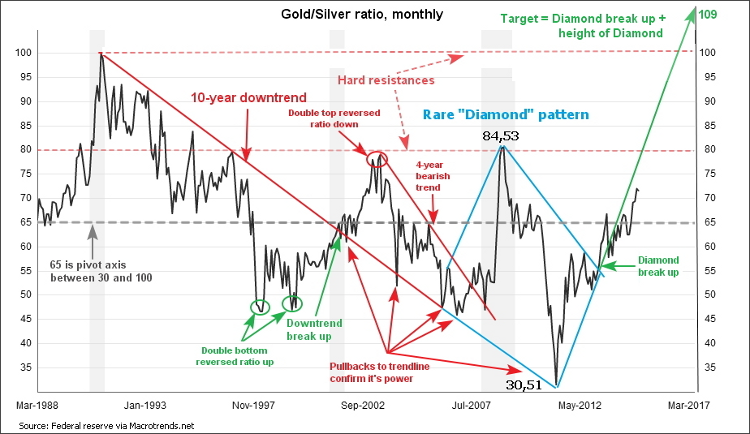
In 2003, the price retraced twice from those highs at the 80 level, drawing a reversal double top pattern. The price quickly crashed like a falling jet and lost an impressive 27 troy ounces, touching the former trendline resistance, now acting as support. Right after that in 2004, the ratio pushed up for a considerable 15 troy ounces, gaining more than half of what was lost in the fall. The price couldn't hold upside and fell into a 4-year medium bearish trend again.

2008 brought the crisis into the world and gold started to be in high demand. It seems like the market forgot about silver during those days, as the ratio charted an almost 90 degree vertical line, soaring like a spaceship. But again and again, the magic 80 level stopped the hysterics and the price softly landed down to the 65 area. The ratio consolidated for two years and in 2010, the price finally broke down with inconceivable acceleration and reached this century's low at the 30 level.

One can notice that the ratio can't hold its gains on both sides of the extremes. Another area worth mentioning is the midpoint between the above mentioned extremes located at the 65 level. We can call it an axis or meridian of the ratio. Price usually holds above or below this level and every time it passes the axis in either direction, the ratio charts small volatility zigzags confirming the power of this meridian.

After the price touched the 30 level low, the bulls entered the market and quickly bought the gold up to 60 level. The ratio then tumbled in consolidation, taking a rest for another shift up to the current 72 level.

Now let's get down to "dessert." I would like you to focus on the "Diamond" pattern, which is drawn in blue to emphasize the rareness of this pattern. Diamond patterns are sculpted by the following price actions: sideways consolidation, extreme development, reverse from extreme, opposite extreme development and again sideways consolidation. All of these market phases happened between 2006 and 2012. "Diamond" is a reversal pattern and the price reversed from this century's low which notably touched the multi-decade downtrend line. The height of the "Diamond" and the breakout point are the most important points of data for target calculation.

As we see, the height of the "Diamond, " which is between 30.51 low and 84.53 high and is worth almost 54 ounces. The "Diamond's" break up point is located at the 55 level in 2013. Now we can add 54 to 55 to get our target at the 109 level. Sounds crazy! But that's the technical outcome of the pattern. It's another 37 ounces from the current 72 level or more than double on investment made. Decent gain!

In my opinion, the target can be hit if we see substantial worsening of the world economy, then gold demand will outweigh silver. There are two main obstacles, first is the usual peak of effective range at the 80 level, as price usually stalls there. The second is the psychologically important 100 level, as it was last time seen in 1991, or 23 years ago, and our target just above this level.

Any pattern is not a dogma. Once price fails to progress upside, we will enter either sideways consolidation or even a downtrend. Below the current level the following supports are important: first is the meridian at the 65 level and the second is the bottom of the effective range at the 45 level.

Lucky trades,

Aibek Burabayev
INO.com Contributor, Metals

Disclosure: This contributor has no positions in any stocks mentioned in this article. This article is the opinion of the contributor themselves. The above is a matter of opinion provided for general information purposes only and is not intended as investment advice. This contributor is not receiving compensation (other than from INO.com) for their opinion.

Platinum And Palladium Chart Analysis

Aibek Burabayev - INO.com Contributor - Metals


Platinum Monthly Chart Analysis

Platinum fell in a downtrend in 2011 after the price formed a reversal double top pattern, which was confirmed on the RSI. Price rapidly reached $1400/oz, scoring $445 for the bears. The market easily overcame 23.6% and 38.2% Fibonacci retracement levels, but was stopped in four consecutive attempts by a very hard 50% level at $1345/oz. The bulls didn't jump at their chance to break upside at the $1676 level after consolidation. Later this peak became the downtrend touch point. It could be classic ascending triangle pattern, but the market turned sideways shaping a rectangle formation instead.

You can see on the chart how accurately the RSI indicator shows real and false breaks on the market. In 2013, the RSI didn't break the 40 level support twice, while price moved below $1400 support twice. And the market reversed up inside of the rectangle.

This year, the price was squeezed between downtrend resistance and 38.2% Fibonacci retracement at the $1470 level on the upside and the rectangle's support at the $1400 level on the lower side. After impulse accumulated enough power, the market first tried testing the upside, but failed and in September moved down and cracked both the $1400 level rectangle support and the 50% Fibonacci retracement level, the last one only with the 5th attempt.

Platinum swiftly appeared at the 61.8% Fibonacci level at $1221/oz. The price managed to drop below it for a while, but the market closed higher at the $1224 level. Continue reading "Platinum And Palladium Chart Analysis"

Will Silver Drop To $4-5/oz?

Aibek Burabayev - INO.com Contributor - Metals

Gold Chart Analysis

On a monthly chart of gold (FOREX_XAUUSDO), the 6 year cycle has entered the final period after the price peaked in 2011 at $1823 close. A descending continuation triangle pattern has been formed. This suggests that the price will proceed in a downward movement.

This line chart shows monthly market closes and it clearly indicates that the triangle's base was broken at the $1180-$1205 level. The price, already for two consecutive months, managed to close below first support. This signal confirms the pattern.

The target is calculated as the distance of the trend before the Triangle was formed, from the peak in August 2012 close at $1764/oz to the low of May 2013 close at $1243/oz, and projected below the triangle's base. I calculated $700/oz level as the target for our move with simple approximation, which coincides with the 6 year cycle's start or base level. This gives more weight to the power of this level.

There is very tough support between $1200 and $700 levels located at $1000/oz. Firstly, it's an important psychological level and secondly, it is a former stiff resistance which was broken only from a 4th attempt in 2009. Only this level can be a serious obstacle on the way down.

Although we see a clear bearish trend, we can't rule out a pattern breakout or total reversal of the trend.

On the upside, the first good resistance is at the $1300 level which is the triangle's upper side, the second good resistance is $1400 – the triangle's first peak.

Gold 1


Silver Chart Analysis

Let's move onto silver (FOREX_XAGUSDO). Like the previous chart of gold, we see a 6 year fading cycle, but the curve is steeper for silver. And of course, you can see that silver dropped far deeper than the gold. If gold dropped around 40% from it's all time high in 2011, then silver plummeted an impressive 70%! Since silver is less liquid, that would explain its volatility. Silver's price action is a good indicator for gold's future moves. Keep that in mind while you search for trading opportunities.

This metal broke all major supports, including the very important level at $20/oz, which is a former resistance level that couldn't be broken for 3 years in a row. Next was the triangle's base at $19/oz. After it was passed, the price quickly fell to new lows at $15/oz. The target was calculated in the same manner as it was calculated for gold, at $4-5/oz to the downside. I would be very cautious once the price reaches $10/oz. Anywhere a two-digit number turns into a one-digit number is an area of prime psychological importance.


Price can start to be volatile between the $10 and $20 levels, which then acts as resistance for a possible price pullback.

After $20, the next good resistance is located at the $24-$35 level, which is the peak of the triangle.

Silver Analysis


Visit back for my metals analysis next week.

Lucky trades,

Aibek Burabayev
INO.com Contributor, Metals

Disclosure: This contributor has no positions in any stocks mentioned in this article. This article is the opinion of the contributor themselves. The above is a matter of opinion provided for general information purposes only and is not intended as investment advice. This contributor is not receiving compensation (other than from INO.com) for their opinion.