Fibonacci Analysis of Two Option Setups

We break down our two favorite option trades in the market currently using Fibonacci analysis. Biotech is leading the charge lower, while this precious metal could be about to lift off.

Learn more about TradingAnalysis.com here.

Plan Your Trade, and Trade Your Plan,
Todd Gordon

One Of These Markets Is Going Down Big Time

Hello MarketClub members everywhere! Not sure if you live in the rain soaked mid-Atlantic states, but enough already with the rain! It is depressing. The reason I bring this up is the erratic and somewhat depressing action in the stock market.

On Tuesday we watched a massive rally in stocks and everyone was singing happy days are here again. Yesterday, reality and gravity came into the market and took away practically all of Tuesday's gains.

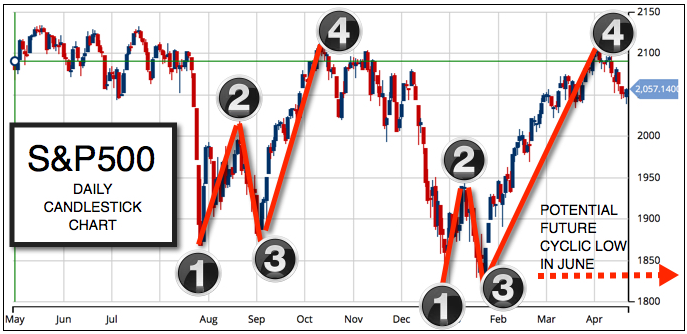
As I said on Monday when I talked about "The Next Big Swing", I believe that the markets are putting in a major top as both the S&P 500 and the NASDAQ have all flashed red weekly Trade Triangles indicating to be out of the market and on the sidelines.

Apple Inc. (NASDAQ:AAPL)
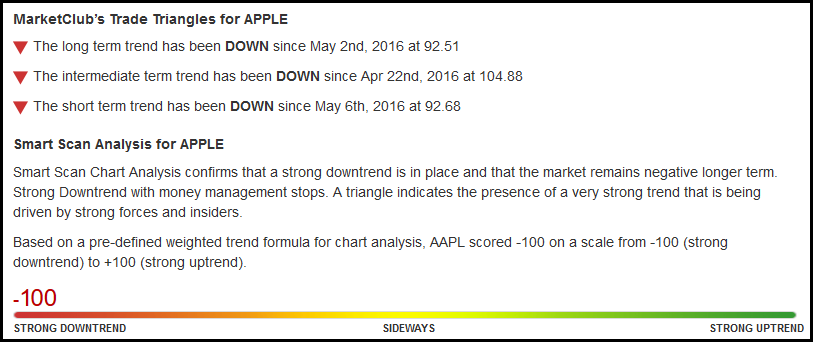
So sad about Apple, here is a stock that was the "apple of every investors' eye" and now this once super stock is now in the dumpster. The question is, with all the Trade Triangles red and pointed lower for Apple, is it just a false signal or is this really the start of a bigger problem? I believe that Apple has some serious hurdles ahead and as the weeks and months pass these problems will come to the forefront.

The biggest problem for Apple right now is that it is not seen as an innovative growth company. Can anyone say "Nokia" and not wonder what happened to this once-leader in the mobile phone market? The next problem Apple has, and this could well be its number one problem, is perception. Apple is just not perceived as a "cool" company anymore. Apple's third problem is expanding its market for its cash cow iPhone. It very much looks like China wants to put the kibosh on any further Apple iPhone sales as they really want to sell their own smart phones (so much for free trade).

The next big psychological level for Apple is $90.00. Once we see around $89, you will see many more investors throw in the towel. On Thursday the 28th of April, Carl Icahn stated on CNBC that he no longer owned any Apple stock. MarketClub's Trade Triangles exited Apple six days earlier at $104.88. I am guessing Mr. Icahn exited around the same time before he made his big announcement on CNBC.

Daily Chart of Apple Inc. (NSDAQ:AAPL)

Continue reading "One Of These Markets Is Going Down Big Time"

The Next Big Swing In Stocks

Over the weekend I was analyzing the charts and it appeared to me that with Friday's red Trade Triangle on the S&P 500 that stocks have topped out. The similarity between August and September and this January and February is quite startling. If the same pattern holds true then the next big swing in the stock market will be to the downside.

Already we have seen weekly Trade Triangles in the NASDAQ (NASDAQ:COMP) and just recently in the S&P 500 (CME:SP500). These weekly red Trade Triangles many times act as early warning system and are a strong indicator to move to the sidelines in the case of the Indices.

I would not be surprised to see more back-and-forth choppy trading action before the market eventually falls under its own weight.

I am looking for stocks to make a cyclical low sometime in June if the same cycle holds true.

Daily Chart S&P 500 (CME:SP500)

S&P 500 Chart Legend

1. First Low
2. Pivot Point
3. Second Low
4. Cyclic High
Continue reading "The Next Big Swing In Stocks"

Weekly Futures Recap With Mike Seery

We've asked Michael Seery of SEERYFUTURES.COM to give our INO readers a weekly recap of the Futures market. He has been Senior Analyst for close to 15 years and has extensive knowledge of all of the commodity and option markets.

Michael frequently appears on multiple business networks including Bloomberg news, Fox Business, CNBC Worldwide, CNN Business, and Bloomberg TV. He is also a guest on First Business, which is a national and internationally syndicated business show.

S&P 500 Futures

The S&P 500 futures in the June contract settled last Friday in Chicago 2059 while currently trading at 2040 right near a 4 week low and if you have been following any of my previous blogs you understand that I do not trade this very often. However, the setup is starting to become favorable as I want to keep a close eye on a possible short position next week. The S&P 500 is trading below its 20-day but still above its 100-day moving average as we are right near major support I do want to see the chart structure to tighten up as the 10 day high is 2094 risking around 55 points or 2,800 per contract plus slippage and commission which is too high of monetary risk to enter at this point. The monthly unemployment report was released this morning stating that the United States added about 160,000 new jobs below expectations with the unemployment rate at 5% having little impact on today’s price as I will keep a close eye on this market as volatility should definitely start to increase as the old saying states “sell in May and go away” as that’s exactly what’s happened so far. Continue reading "Weekly Futures Recap With Mike Seery"