Weekly Futures Recap With Mike Seery

We’ve asked Michael Seery of SEERYFUTURES.COM to give our INO readers a weekly recap of the Futures market. He has been Senior Analyst for close to 15 years and has extensive knowledge of all of the commodity and option markets.

Michael frequently appears on multiple business networks including Bloomberg news, Fox Business, CNBC Worldwide, CNN Business, and Bloomberg TV. He is also a guest on First Business, which is a national and internationally syndicated business show.

Coffee Futures

Coffee futures in New York hit another contract high last Wednesday at 209.75 before profit taking ensued closing around 198 in the May contract still continuing its bullish momentum closing higher by about 200 points for the trading week. The chart structure in coffee has finally improved to a point where you can actually put a realistic stop loss as the new 10 day low is at 181.50 and if your still long this market that is where I’m recommending to place your stop loss which is still about 20 points away equaling around $7,500 per contract. Continue reading "Weekly Futures Recap With Mike Seery"

Did You Miss Adam on CNBC Asia's Cash Flow?

Adam explains why he sees Copper (NYMEX:HG.K14.E) prices falling to a range of $2.50 to $2.67 in the second-quarter.

Adam also explained that the ongoing instability in Ukraine is far more serious than we can imagine, with Russian president Vladimir Putin seemingly determined to bring Ukraine back under Russia.

Is Bitcoin The New Gold Standard?

The last month or so has been an interesting one for Bitcoin (BITCOIN:BITSTAMPUSD) believers. No doubt you have heard about the collapse of Mt.Gox, the largest Bitcoin exchange in the world and the missing millions.

If the collapse of the Mt.Gox exchange was not enough, Newsweek announced to the world that they have tracked down the mystery man who they claim invented Bitcoin. The gentleman’s name is Satoshi Nakamoto and it has long been assumed to be the pseudonym for the man (or woman) who created Bitcoin. Satoshi Nakamoto subsequently denied that he was the brains behind Bitcoin, so the mystery continues, or does it? You would think with a major Bitcoin exchange collapsing, all the controversy and lost funds, Bitcoin would have collapsed to zero, as everyone rushes to cash out their virtual currency.

But oh no, the opposite appears to be happening when you view the recent Bitcoin (BITCOIN:BITSTAMPUSD) market action. One thing is for sure, the Bitcoin market is not going down anytime soon based on the technical charts that I look at.

This is a follow up post to my earlier Bitcoin post. Now you can see Bitcoin charts and quotes on MarketClub and on our public website, INO.com. The truth is, Bitcoin trades just like any other market, including gold.

Is Bitcoin the new gold standard?

Chart Legend & Technical Picture For BITSTAMPUSD (Black Numbers)

1. Classic base
2. Classic chart breakout
3. Double top
4. Double bottom
5. Downtrend line
6. Double bottom
7. Watch for breakout
8. Trade Triangles

Bitcoin (BITCOIN:BITSTAMPUSD) technically looks a lot like gold did after it made its double bottom last December. The key level to watch in this market is a break over (5) on the chart. Any move over $700 should be viewed as extremely bullish for Bitcoin, signalling a move to test the $1,000 area.

Every success with MarketClub,
Adam Hewison
President, INO.com
Co-Creator, MarketClub

Bulls or Bears - Who Will Win?

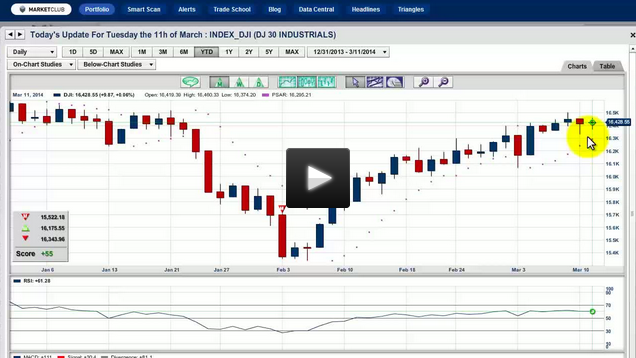
Hello traders everywhere! Adam Hewison here, President of INO.com and co-creator of MarketClub, with your video update for Tuesday, the 11th of March.

The Dow Is Balanced

Looking at the Dow Jones Industrial Average (INDEX:DJI), you have half of the stocks in a bull trend and the other half in a bear trend, giving a very mixed picture and somewhat neutral look to the Dow 30. The question is, which side is going to win out, the bulls or the bears? As with any market, I will be watching the Trade Triangles for an indication of this index's next move.

Gold Adjusting To New Levels

After rallying over $150 from the lows that were seen in late December, the gold market has gone into a sideways pattern as it begins to readjust to its new trading levels of $1,320 to $1,360. At the moment, it would look like short-term traders should be out of this market and that long-term traders could hold on to long gold positions. I'm still see the Gold (FOREX:XAUUSDO) moving higher longer-term. Continue reading "Bulls or Bears - Who Will Win?"

Chart of The Week - Natural Gas

Each Week Longleaftrading.com will be providing us a chart of the week as analyzed by a member of their team. We hope that you enjoy and learn from this new feature.

This week’s focus turns to the May 2014 Natural Gas futures (NYMEX:NG.K14.E), where the transition into spring seasonality and warmer weather has weighed down demand outlook. Over the winter months, we had continually seen larger than expected draws from Natural Gas supplies due to extreme winter conditions, but as US weather forecasts continue toward warmer levels, it appears the threat to already tight near-term supplies is diminishing.

Since reaching a high print of 4.893 a few weeks ago on February 24, 2014, May Natural Gas has taken a slight leg lower and consolidated over the past few weeks as it decides where it will head next. The Commitments of Traders report as of March 4th has shown traders have gone from a net long to a net short position on Natural Gas, which hints that the recent strong up-trend may be losing steam. In the near-term, I would agree with this negative bias, and look for a correction in the Natural Gas market.

For a swing trade, I would be a seller as the market moves below Friday’s low of 4.530. My near-term target would be the swing low of 4.393. This position would allow you to use the 20 day moving average as a resistance point, as this indicator has kept the market in check during the recent consolidation period. Continue reading "Chart of The Week - Natural Gas"