Buy Zones For These Two Small-Caps

It’s been a solid year so far for the major market averages, with the market up 7% year-to-date, a solid rebound after what was a brutal year in 2022.

However, the small-cap universe hasn’t fared nearly as well, with the Russell 2000 Index (IWM) barely in positive territory.

I attribute some of this underperformance to the relatively high weighting of regional banks in the index, which were hit hard following fears of bank runs.

Fortunately, this underperformance has left some small-cap names trading at deep discounts to fair value, and one has been stuck in the mud despite the significant metals price increases in the precious metals sector.

In this update, we’ll look at two small-cap names becoming more reasonably valued, and where I see their ideal buy zones.

Buckle Inc. (BKE)

Buckle Inc. (BKE) is a $1.7 billion company in the Retail-Apparel industry group that was one of the market’s best performers last year as it raced towards its multi-year highs near $50.00 per share.

However, the stock has since pulled back over 30% from its highs, and found itself back near key support at the $30.00 level.

For those unfamiliar, Buckle has over 440 stores in the United States and specializes in jeans, other apparel, footwear, and accessories.

The company released its Q4 2022 results (three months ended January 28th) last month and reported net sales up 5.5% year-over-year to $401.8 million. Meanwhile, quarterly earnings per share were up 3% to $1.78, while full-year EPS came in at $5.13, down just 1% from the year-ago period. Continue reading "Buy Zones For These Two Small-Caps"

Gold And Tesla: Bulls Check Barriers

Last month, I presented three potential scenarios for the future price of gold in an earlier Gold Update.

In the poll, most of you chose the green path, which suggested an extended period of consolidation for the yellow metal. However, it appears that the blue (straight bullish) and black (similar to the pattern observed in 2017) paths are more accurate, as the green path is no longer viable.

Gold Futures Daily

Source: TradingView

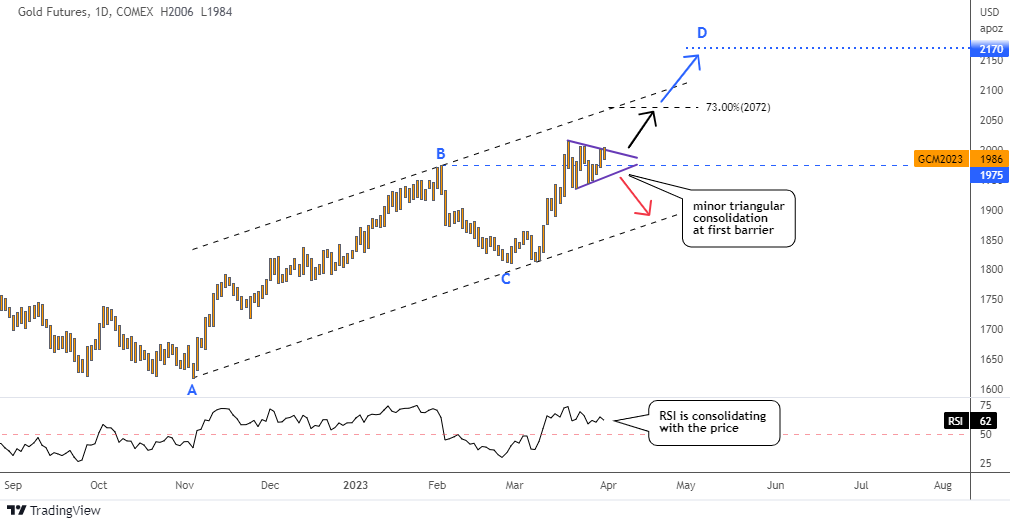
In just two weeks since the last update, the price of gold futures has increased by $160 or nearly 9%, reaching a high of $2,015 on March 20th. This surge in price caused the previous top at the blue B point of $1,975 to be broken, but the price has since been consolidating around this level.

The price of gold futures has formed a triangle pattern (purple) characterized by falling peaks amid rising valleys. The size of the pattern is relatively small, and last week, the price attempted to break out of the pattern to the upside but was unsuccessful.

As a result, the upside potential of the move may be limited due to the small amplitude of the pattern. Continue reading "Gold And Tesla: Bulls Check Barriers"

Opportunity To Get Ahead Of The Curve?

At the end of March, interest rates now sit at 6.32% average across the country for a 30-year fixed rate mortgage. While this is lower than a few weeks ago, they are still much higher than a year ago.

The cause is that the Federal Reserve has been raising rates aggressively over the last year to fight persistently high inflation. The Fed's goal of raising rates is to slow the economy and bring inflation back down to a normalized level or target goal of 2%.

Raising rates makes large capital expenditures for businesses or individual households more expensive, thus creating a situation where it is no longer affordable or makes good business sense to make those investments.

Fewer large investments or fewer new homes being built because the financing costs of making those purchases are too high will eventually slow the economy and thus bring inflation down.

While we all want inflation to come down quickly, it takes time for high-interest rates to flow through the system and change business leaders' and households' decision-making.

Furthermore, there is a rather big delay with the economic data that tells us how the economy is performing and whether or not large investments, home purchases, and overall spending is slowing.

This all means that when we realize business leaders-consumers have changed their minds about what investments and purchases are worth making, the economy is already slipping.

If we now look strictly at the household side of the equation, it seems clear that this group is heading toward tough times in the not-so-distant future, thus making the idea of a new home purchase much less likely.

First, we have high inflation. This is making everything across the board more expensive. Consumers' average cost of living is increasing, whether it be groceries, child care, transportation, or clothing. Continue reading "Opportunity To Get Ahead Of The Curve?"

Gold Developers At A Discount

It’s been an exciting year for the Gold Miners Index (GDX) with the index up 12% year-to-date and significantly outperforming the S&P-500 (SPY) for a second consecutive year.

This strong performance can be attributed to the recent strength in the gold price, with the metal launching 10% higher over the past month to hang out near psychological resistance at $2,000/oz.

The recent strength is a big deal for the average producer, which up until January suffered from considerable margin compression with a flat gold price since 2020 yet inflationary pressures across the board.

Unfortunately, for investors hanging out in the gold developer space, the returns have been dismal. Not only have the developers massively lagged the producers and many are scraping along the lows of their multi-year ranges, but they’re under-performing this year despite already lagging by 2000+ basis points last year as well.

This is obviously quite disappointing for investors and in some cases it may be leading to some irrational or forced selling as some investors are tired of not participating in the gold price move and choose to dump their shares.

In this week’s update, we’ll look at two names that continue to trade at massive discounts to fair value that offer a way to get leverage to gold without chasing names already up substantially year-to-date.

i-80 Gold (IAUX)

i-80 Gold (IAUX) is a $840 million market cap gold developer that has a resource base of ~15.0 million ounces of gold in the state of Nevada.

This is an enviable position to be in given that Nevada is one of the top-ranked jurisdictions globally for mining with an abundance of resources, access to a considerable workforce, and favorable permitting historically.

The company differentiates itself from its peer group for several reasons, with the main one being that it has the #1 growth profile sector-wide, with a plan to grow its production profile from ~30,000 ounces in FY2023 to ~250,000 ounces by H2 2026, with the potential to grow to 400,000 to 450,000 ounces long-term. Continue reading "Gold Developers At A Discount"

Platinum Cleared The "Launch Pad" For Palladium

In a previous post titled "Platinum Outshines Palladium, Yet Both Offer Opportunity," I discussed potential opportunities for investors to buy into these two white metals.

The fact that platinum was chosen over palladium by three out of five readers in the ballot was not surprising. The platinum/palladium ratio and the chart setup for platinum futures were both supportive of the title's argument.

Let’s check on what has changed in one month. We'll start with platinum futures.

Platinum Futures Daily

Source: TradingView

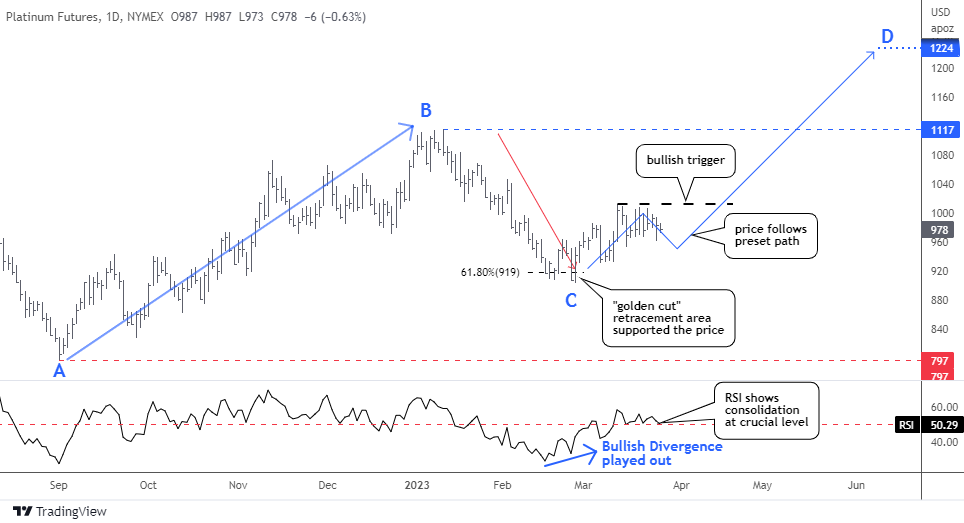
The price of platinum futures has been following my predetermined path with remarkable accuracy. I kept the previous annotations for you to see it.

The forecast that the price would reverse around the "golden cut" 61.8% Fibonacci retracement area proved to be successful, as the price tested the support twice and held. Subsequently, the futures price mimicked the trajectory of the blue zigzag, moving to the upside. Continue reading "Platinum Cleared The "Launch Pad" For Palladium"