Is Apple Going To Upset The Apple Cart And The Market?

I'm not sure how you're feeling, but I am feeling a little uneasy about where the market is trading particularly this week. Please don't misunderstand what I'm saying, I am not saying that the market is going to crash this week, nor am I saying that it is going to soar to new highs. It just all seems a little surreal and that's what is making me feel uneasy.

As I have mentioned before, the Trade Triangles are indicating a trading range scenario for the major indices. Intermediate-term traders should be on sidelines at this time. All of the major indices are close to butting up against resistance which should slow and halt any further upside progress from here.

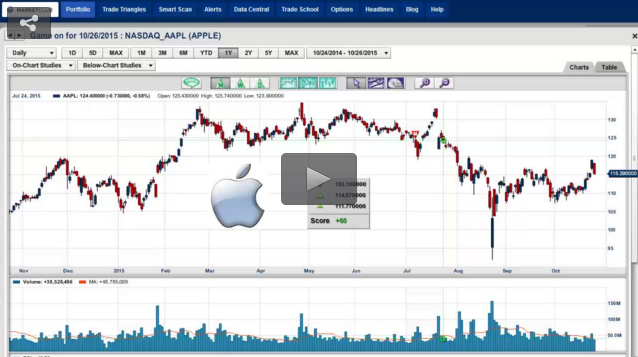
Apple is set to report earnings

After the close on Tuesday, Apple Inc. (NASDAQ:AAPL) reports its Q3 earnings. This could be a game changer for Apple and also for the market. Judging by the market action especially today, I think the report is going to be somewhat neutral to negative and show little or no growth for their iPad and iPhone business. The Trade Triangles are saying that you should be on the sidelines right now and that's where I intend to be. The only thing that would move me off the sidelines is if I see a move below $109.50 either today or tomorrow. If that happens, then I'll want to be short going into the report.

Maybe that's why I am feeling a little uncomfortable this week about the market. Continue reading "Is Apple Going To Upset The Apple Cart And The Market?"

Are The Stars Aligning For Oceaneering?

Adam Feik - INO.com Contributor - Energies


I happened to notice Oceaneering International (NYSE:OII) is flashing 3 green triangles on MarketClub.

This is a stock that last saw its shares trade at $86 per share on November 4, 2013 (almost exactly 2 years ago), hit a low of $37 on August 25 (almost exactly 2 months ago, on the same day the broad market touched its recent bottom), and is now changing hands at nearly $47.

That’s a 57% freefall over 22 months, followed by a 27% gain over 2 months. See for yourself:

Daily Chart of Oceaneering International Inc. (NYSE:OII)

Why should you care? Well, I don’t know that you should, seeing as how Oceaneering is in the business of providing engineering services primarily to deepwater drilling companies, which doesn’t exactly seem like a hot corner of the market these days. But… Continue reading "Are The Stars Aligning For Oceaneering?"

Optimizing the ABC Charting Formation

As a special treat to Trader’s Blog readers, Ron Ianieri is offering you an in-depth look at how to optimize the ABC charting formation.

The ABC Charting Formation is one of the most basic and frequently occurring charting patterns that exist. Watch how this basic chart can be turned into a big payday with the use of options. Follow along as we use options to safely and easily follow the ABC's charting patterns twists and bends. We start out with the most basic and most easily understood strategy, roll it, morph it and finally close it. Suddenly, this simple charting pattern, traded with the simplest option strategy, becomes a sophisticated looking trading strategy that is incredibly simple to use, fully hedged at all times, and very profitable!

The concept of synthetics has always been fundamentally important to understanding options. Synthetics show us the mathematical relationship that exists between the stock, a call, and its corresponding put. This mathematical relationship not only relates the price of these instruments in relation to each other, but also shows how a call can be changed into a put, or a put can be changed into a call by simply adding the stock into the equation. Understanding synthetics allows investors the ability to morph positions from the wrong position to the right position quickly and efficiently. Understanding synthetics also allow investors to take advantage of the put/call skew we frequently see in the options market today.

Watch it now: Optimizing the ABC Charting Formation

Best,
The INOTV Team

Currency Devaluation's Dangerous Role in Deflation

By Elliott Wave International

The following article on currency devaluation's role in deflation is from Elliott Wave International, the world's largest financial forecasting firm. EWI has just released a new report, Deflation and the Devaluation Derby, to help investors prepare now for the deflationary threat they see around the corner. Click here to read the new report >>

China's economy is slowing. Its stock market began to crash back in July. And the volatility rocking financial markets has been widely linked to the recent yuan devaluations by China's central bank.

"Surprise" has been a common word used by investors and financial pundits to describe the devaluation -- as in, "China's central bank surprise devaluation of yuan."

But what if we told you it wasn't a surprise -- it was in fact an expected event?

Below are three excerpts from analysis that EWI's own Chris Carolan published in his Sun-Tue-Thu Asian-Pacific Short Term Update on July 30 (several days before China's central bank first move to devalue the yuan against the U.S. dollar), then on Aug. 9 and Aug.11 (bold added).

The Asian-Pacific Short Term Update , July 30:

Continue reading "Currency Devaluation's Dangerous Role in Deflation"

Weekly Futures Recap With Mike Seery

We've asked Michael Seery of SEERYFUTURES.COM to give our INO readers a weekly recap of the Futures market. He has been Senior Analyst for close to 15 years and has extensive knowledge of all of the commodity and option markets.

Michael frequently appears on multiple business networks including Bloomberg news, Fox Business, CNBC Worldwide, CNN Business, and Bloomberg TV. He is also a guest on First Business, which is a national and internationally syndicated business show.

Gold Futures

Gold futures in the December contract settled in New York last Friday at 1,183 an ounce while currently trading at 1,161 down over $20 for the trading week despite the fact that China cut their interest rates by 25% and the ECB announced yesterday to add more stimulus in silver which is generally bullish gold prices are just the opposite is happening is the U.S dollar is up 200 points in the last two trading days putting pressure on many commodities. Gold prices are still trading above their 20 and 100 day moving average telling you that the short-term trend is to the upside, however all of the interest is back in the S&P 500 which is up over 60 points in the last two trading days as the technology sector has caught fire once again with Amazon, Google, and Microsoft all up sharply today as money flows are going back into the equities. Continue reading "Weekly Futures Recap With Mike Seery"