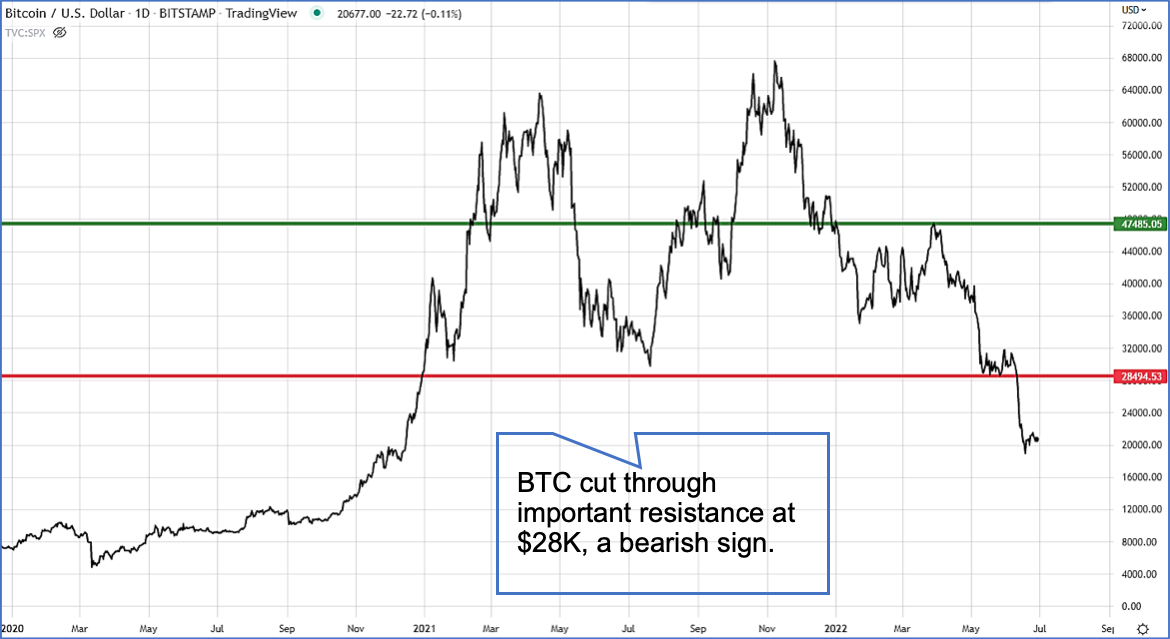
There’s no doubt about it: Bitcoin (BTC) has broken down. In fact, it recently sliced through significant support at the $28K level like a hot knife through butter. Take a look...
Source
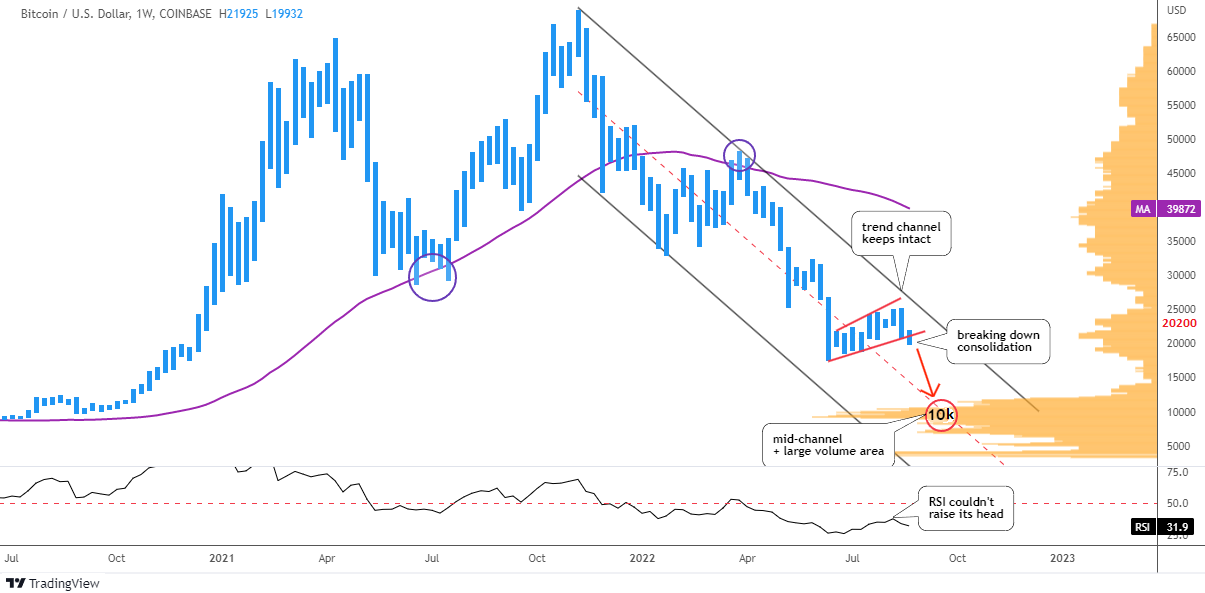
As you can see from this daily chart of BTC, the dominant crypto dropped below resistance that had been firmly established back in 2021. I recently wrote about this level being a crucial line in the sand for BTC. And unfortunately, it failed to hold up.
So, where do go from here? If you look at the left side of the above chart, it’s clear that the best case for BTC support now sits somewhere in the range of $6K to $12K. And from its current level, it’s pretty much a straight shot to that range.
In addition, BTC spent quite a bit of time meandering in that range during 2020. I wouldn’t be surprised that, if we get that low, you’ll see similar sideways action.
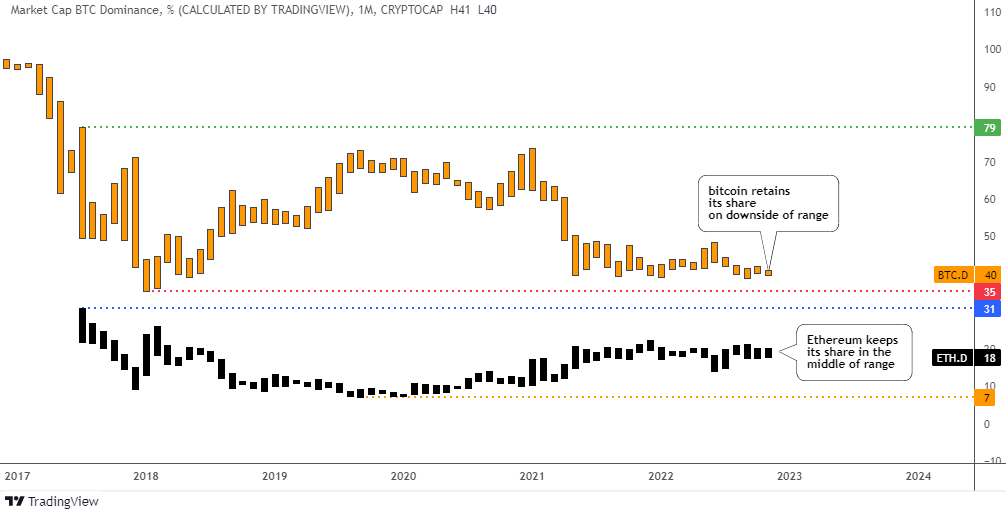
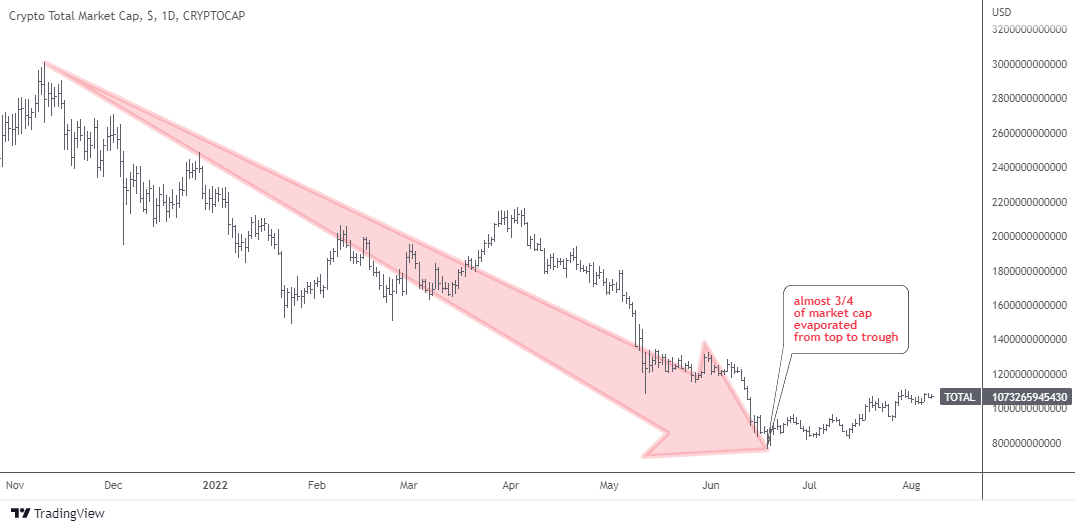
And it’s not just BTC that’s gotten hammered. In fact, the entire cryptocurrency space now stands at somewhere around $1 trillion in market cap. That’s a far cry from the $3 trillion it enjoyed late last year.
Ouch.
But before you sound the death knell of crypto, remember that it’s not the only asset that’s been taken out back recently. In fact, I could just as easily put a chart up there of the Dow, the S&P, the Nasdaq, and the Russel 2000 and you would be reading much the same story, albeit not as dramatically.
Fear is Driving Selling
As I’ve been saying for months, investors are looking at crypto just like they do every other risky asset... they are selling. And they’re selling pretty much regardless of what’s happening to the asset’s underlying fundamentals.
Why all the selling? Pretty simple: The markets are oozing with fear right now. And when fear takes over, lots of assets get thrown out, no matter how good their underlying fundamentals may actually be.
That’s sad, but it’s true.
So, what’s driving all the fear? Take your pick. Inflation, global supply chain issues, the war in Ukraine, geopolitical uncertainty, higher interest rates.
And the rub of it is that all of these are playing a significant role in amping up the fear in the marketplace. If it was just one, it wouldn’t be so bad. But it’s not - it’s all of them.
The war in Ukraine is contributing to inflation of energy and food prices. Supply chain issues are contributing to higher prices and operational uncertainty. Meanwhile, inflation is making everything more expensive.
But it’s the last fear driver that I mentioned - higher interest rates - that really has everyone on edge. And while we all agree that those higher interest rates are the medicine to fight inflation, no one knows for sure how high they must go to get results. So far, inflation continues to roar higher despite higher interest rates.
Maybe we can take some solace in the fact that the Fed will likely continue to raise rates until the inflation numbers are headed in the right direction. Chairman Powell’s said as much to Congress just last week. And I don’t have much doubt about his - or the Fed’s - resolve to bring inflation down.
But until we begin to see inflation numbers drop, it’s a done deal that you’ll see more of the fear-based volatility and chop that you’ve seen for stock, tech, and crypto since the beginning of the year.
Sure, you’ll likely see some up weeks in the meantime. And there’s little doubt that an outlier or two in these asset classes are likely to thrive. But overall, until inflation gets under control, the outlook for crypto, stocks, and tech is lousy.
We Shouldn’t Be Surprised
The fact is we shouldn’t be surprised by what’s happening in all these risky asset classes. There’s had been gobs of money sloshing around the economy for years. And that low-priced capital has made just about everyone go out and buy a ton of stuff.
In my book, that’s been a good thing. It’s helped people and business weather a massive pandemic, driven innovation, and provided much-needed jobs for millions.
But one of the side effects of that cheap money has been inflation levels, unlike anything we’ve seen in decades. Certainly, because of all that cheap money, I figured we might see an uptick in inflation. But I had no idea it would come at us in such magnitude. Nobody did.
And when it comes to crypto, we shouldn’t be surprised that it’s been beaten up even more than its peers. While risk has had a hand in that, the fact that crypto is still a nascent and largely unproved asset class and marketplace make it worse. It’s simply going to get beat up worse when investors lose their appetite for risk.
So, what to do? As I mentioned, I think we’re going to see a moderation in inflation down the road. And when that happens the markets - including crypto - will start to recover. When that happens - and let’s say we get a handful of decent inflation reports - I would begin heeding my golden rule: Buy companies that know what they’re doing in markets with strong upside. And don’t sweat the small stuff. Take a long-term view. And don’t devote any more than 1% to 2% of your portfolio to all your crypto holdings, including BTC.
Stay safe,
Wayne Burritt
INO.com Contributor
Disclosure: This contributor may own cryptocurrencies, stocks, or other assets mentioned in this article. This article is the opinion of the contributor themselves. The above is a matter of opinion provided for general information purposes only and is not intended as investment advice. This contributor is not receiving compensation (other than from INO.com) for their opinion.