The Laws Of Gravity Haven't Changed

What's changed since stocks cratered and made a low in early February? There are few signs that monetary easing in China, Europe and Japan is helping pull the global economy out of a slump. It seems like the Fed has run out of ideas to jump-start the US economy, and like the other world central banks, has no more tricks in their bag. That is the backdrop of what is going on for world stocks this morning.

Here's what I'm watching today. Continue reading "The Laws Of Gravity Haven't Changed"

This Is Status Quo Time

Hello MarketClub members everywhere! Despite the rally on Friday, there's been little change to the overall status quo of a broad trading range that I believe the indices are in.

Indices

On Friday the DOW (INDEX:DJI) closed at its best levels in 10 weeks, bringing it back up to the Nov/Dec lows which should act as natural resistance. The Dow is still in a 61.8% Fibonacci close-only retracement mode and should begin to falter around current levels. That's not to say that it can't go a little higher, but I think that it's doubtful that it can sustain higher values.

You can see much of the same picture with the S&P 500 (CME:SP500) as it is back into an area of Fibonacci resistance. I still believe that this index is cranking out a major top which began in August 2014. This week should be an interesting one as I expect to see more two-way trading, the key of course is where it closes Friday. Continue reading "This Is Status Quo Time"

No Surprises With This Week's Choppy Action

Hello MarketClub members everywhere, it's Friday and the market action this week reflected what I said in last Friday’s post titled, This Rally Will Come To An End Very Soon.

Major Indices

The major indices continue to be in “thin air” as the choppy market action I predicted last week continued this week. I would not be surprised to see further choppy action this coming week as the fight between the bulls and the bears continue.

Here are the major resistance points on a close-only basis that I see each for each of the major indices.

DOW (INDEX:DJI) - 17,178
SP500 (CME:SP500) - 2,011
NASDAQ (NASDAQ:COMP) - 4,830

The two arguments, of course, are: Continue reading "No Surprises With This Week's Choppy Action"

Getting Ready For The Next Big Move

Seven years ago the DOW was trading around 6000, today this index is over 17,000. So what is the next big move in this index? I suspect the next big move will be on the downside.

Today, China announced that exports hit a 7-year low which indicates to this observer that economies around the world are slowing down.

Technically in many of the major stocks we still have red monthly Trade Triangles indicating that the trend is still down longer-term. The same holds true for the major indices where we are still seeing monthly red Trade Triangles.

At the end of last week, I indicated that I expected this week to be choppy and range bound, as the major indices have all reached major Fibonacci resistance points. I expect the indices to turn back down after a week or two. I still hold to that belief and want to watch these markets very carefully looking for an entry point to go short. Continue reading "Getting Ready For The Next Big Move"

Time To Buy Oil

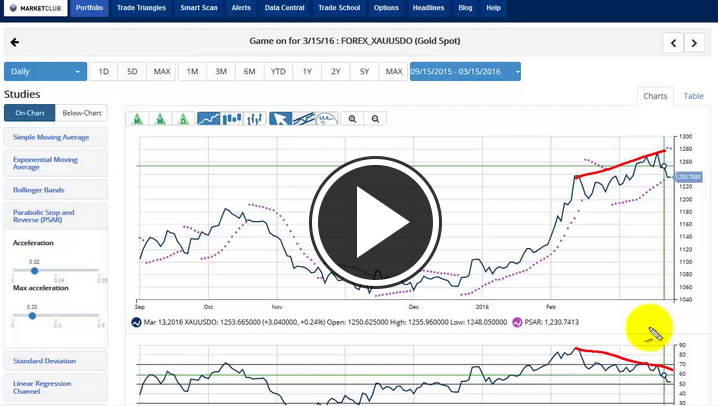
It has taken some time, but it looks like Saudi Arabia has finally won the oil wars. The long and steady decline in crude oil, which has taken over five years, has taken its toll on many small oil producers who have effectively been driven out of business. Saudi Arabia's cost of producing oil is probably the lowest in the world and even at $30 a barrel, they are still making a ton of money.

Crude Oil

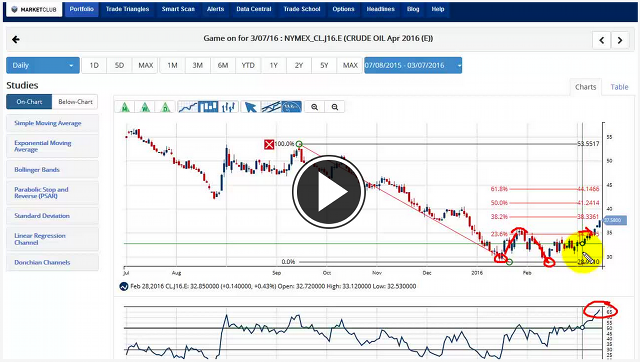
An amazing side effect was the fact that the stock market was driven higher as oil prices were driven lower. The perceived theory behind this is that the consumer could fill up their car at a lower cost and therefore would have more disposable income. Now that oil prices are moving higher, will the reverse happened and push equity prices lower? I believe that is exactly the direction we are headed in right now, oil prices higher, equity prices lower.

Our Trade Triangle technology may have already picked that up with a monthly red Trade Triangle in place for all of the major indices, indicating longer-term lower prices. In the case of crude oil, we use the weekly Trade Triangle which is now green indicating prices are headed higher. This is the first green weekly Trade Triangle for crude oil we have seen in over five months. Continue reading "Time To Buy Oil"