Gold Miners Show The Way

[edit] It goes without saying that gold miners and the royalty companies that live off them will be shown to have been impaired like many other companies by the coming Q2 numbers due to shutdowns. An emailer questioned my view on this and it has been one of my personal caution points. Markets should be looking ahead, but during this euphoric sentiment release across broad markets maybe they’re overlooking some things. The other caution point is that a big bullish expression on the heels of the Fed announcement is also a setup for short-term disappointment. So with respect to the daily chart below, maybe Friday’s gap will fill after all. But as noted in the article below “the gold stocks lead and their fundamentals and value proposition will have improved by leaps and bounds as we exit the COVID-19 global lockdown”.

It’s a good Friday because I get to start my weekend work earlier. Many people temporarily have no weekends because they are huddled at home as one day bleeds into the next amid the global pandemic. Monday is Thursday is Saturday. Good Friday is Halloween is Festivus.

But when times are normal I have no weekends, working 7 days and most intensely on the weekends (with more freedom than the average worker on weekdays). When times are abnormal like now, I work hard on weekends but the more intense days are during the week. As one subscriber put it:

“What a wild ride lately… Thanks for busting your ass for us all lately. As always, you’re the only reason I can handle being in this game.”  -Tom A  3.25.20

That was in reference to the massive amount of in-week effort we (I write “we” because it takes effort to be an NFTRH subscriber because they are tasked to work, not just receive instructions from some clown dressed as a guru) put in to manage volatile markets with formal subscriber updates and in particular, more dynamic in-day updates (with charts as needed) at the Trade Log Notes page. I believe you must be at your best and most interactive when most needed, especially during a crisis, not sitting on autopilot hoping no one notices.

When you’ve got a tiger by the tail you may not know exactly how it is going to react but you sure as hell don’t let go! Continue reading "Gold Miners Show The Way"

The Men Who Stare At Charts

gold/silver ratioI was going to look around to see if I could find a media article out there (complete with a TA trying to sound really important) that would be appropriate to be made fun of in our little Men Who Stare at Charts series. But then I decided to create my own chart, stare at it a little, post it and talk about it (hopefully not too self-importantly).
Introducing an all too busy long-term (monthly) view of the Gold/Silver ratio, along with some key nominal markets.

The Continuum in the lower panel symbolizes the deflationary backbone that has been in place for decades. I maintain that this is a firm marker against which the Fed inflates money supplies, manipulates bonds and by extension manipulates inflation signals. We have been on a theme that like Jerome Powell or hate him, he knows exactly what he is doing because to do otherwise (promote ongoing bubbles on top of bubbles) would, in essence, end the Fed’s racket, as symbolized by a real breakout in long-term yields. Continue reading "The Men Who Stare At Charts"

Gold/Silver Ratio: Another Chance To Short?

Aibek Burabayev - INO.com Contributor - Metals


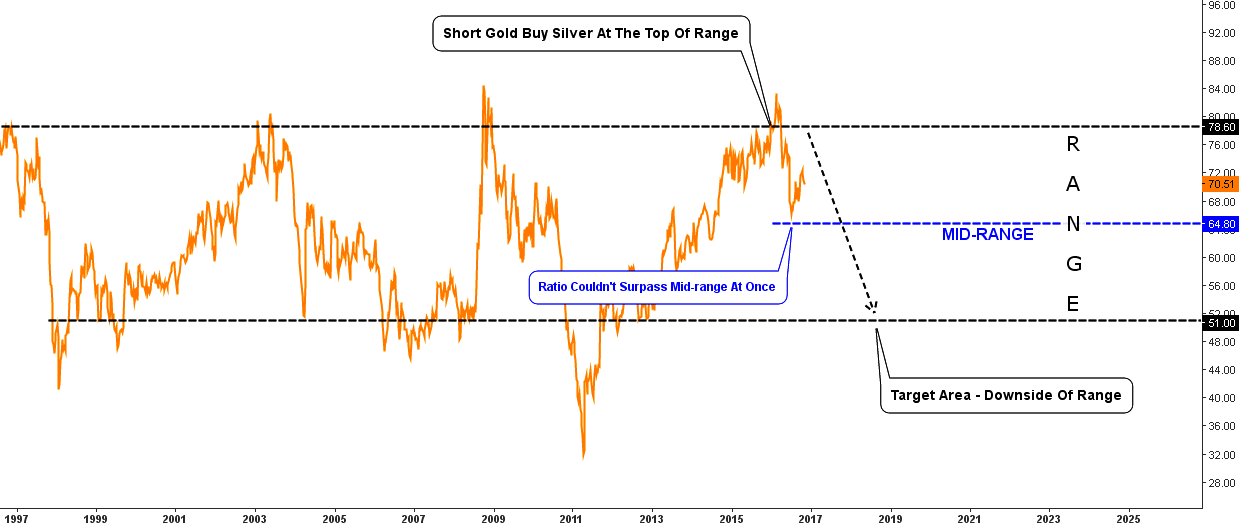
In February I posted an idea to short gold and buy silver simultaneously at the 79 oz level as the ratio hit the top of the multi-decade range. The progress was surprisingly good and I wrote about it in July update and then the ratio stalled. Today I would like to show how we can use this respite to pocket gains.

Below is the ‘face-lifted’ February chart where I put focus on the main idea.

Chart 1. Gold/Silver Ratio: Mid-Range Set Strong Barrier

Gold/Silver ratio Chart Mid-Range barrier
Chart courtesy of tradingview.com

This is the so-called ‘bird’s-eye’ view of the ratio. Twenty years in the range with rare overshoots beyond the range and the single ultra-strength of silver in 2011, this could be titled as the fearless or careless time as you wish. Continue reading "Gold/Silver Ratio: Another Chance To Short?"

Gold/Silver Ratio: Halfway To The Target

Aibek Burabayev - INO.com Contributor - Metals


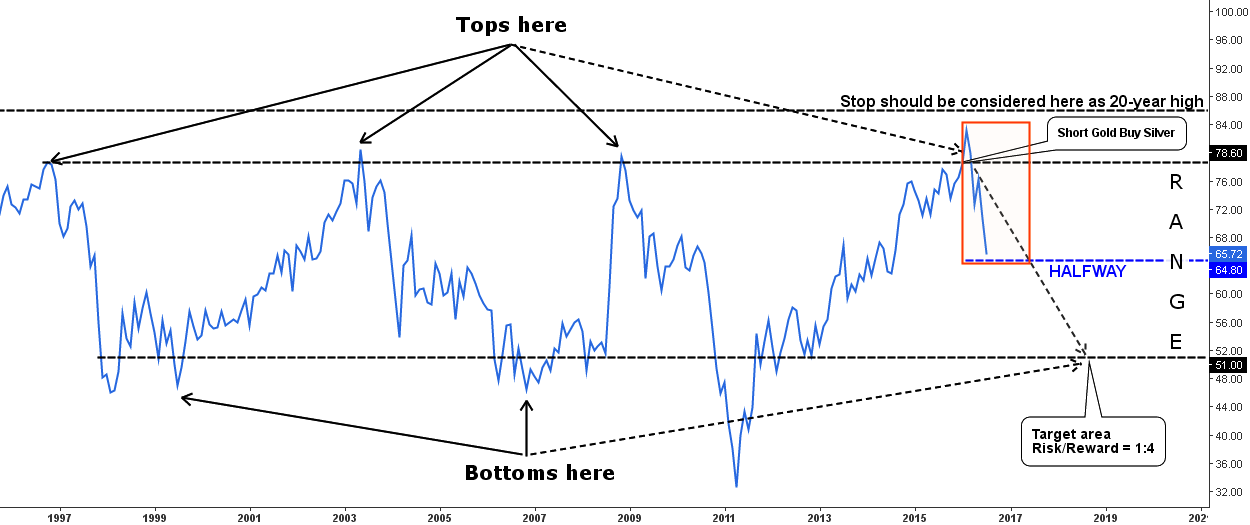
In my February post I called for the topping of the ratio as it hit the upside of the long-term range. The idea was to short gold and buy silver simultaneously at the 79 oz level. It's gone very well, and you can see it in the following charts.

Below is the reconstruction of the February chart to refresh your memory.

Chart 1. Gold/Silver Ratio Monthly: Half Of The Range

Gold/Silver Ratio Monthly
Chart courtesy of tradingview.com

I changed the color of my old remarks to black to stress your attention to the new colored annotations. The post-idea ratio dynamics are highlighted with the orange rectangle. Continue reading "Gold/Silver Ratio: Halfway To The Target"

Gold/Silver Ratio: Gold Loses Its Shine

Aibek Burabayev - INO.com Contributor - Metals


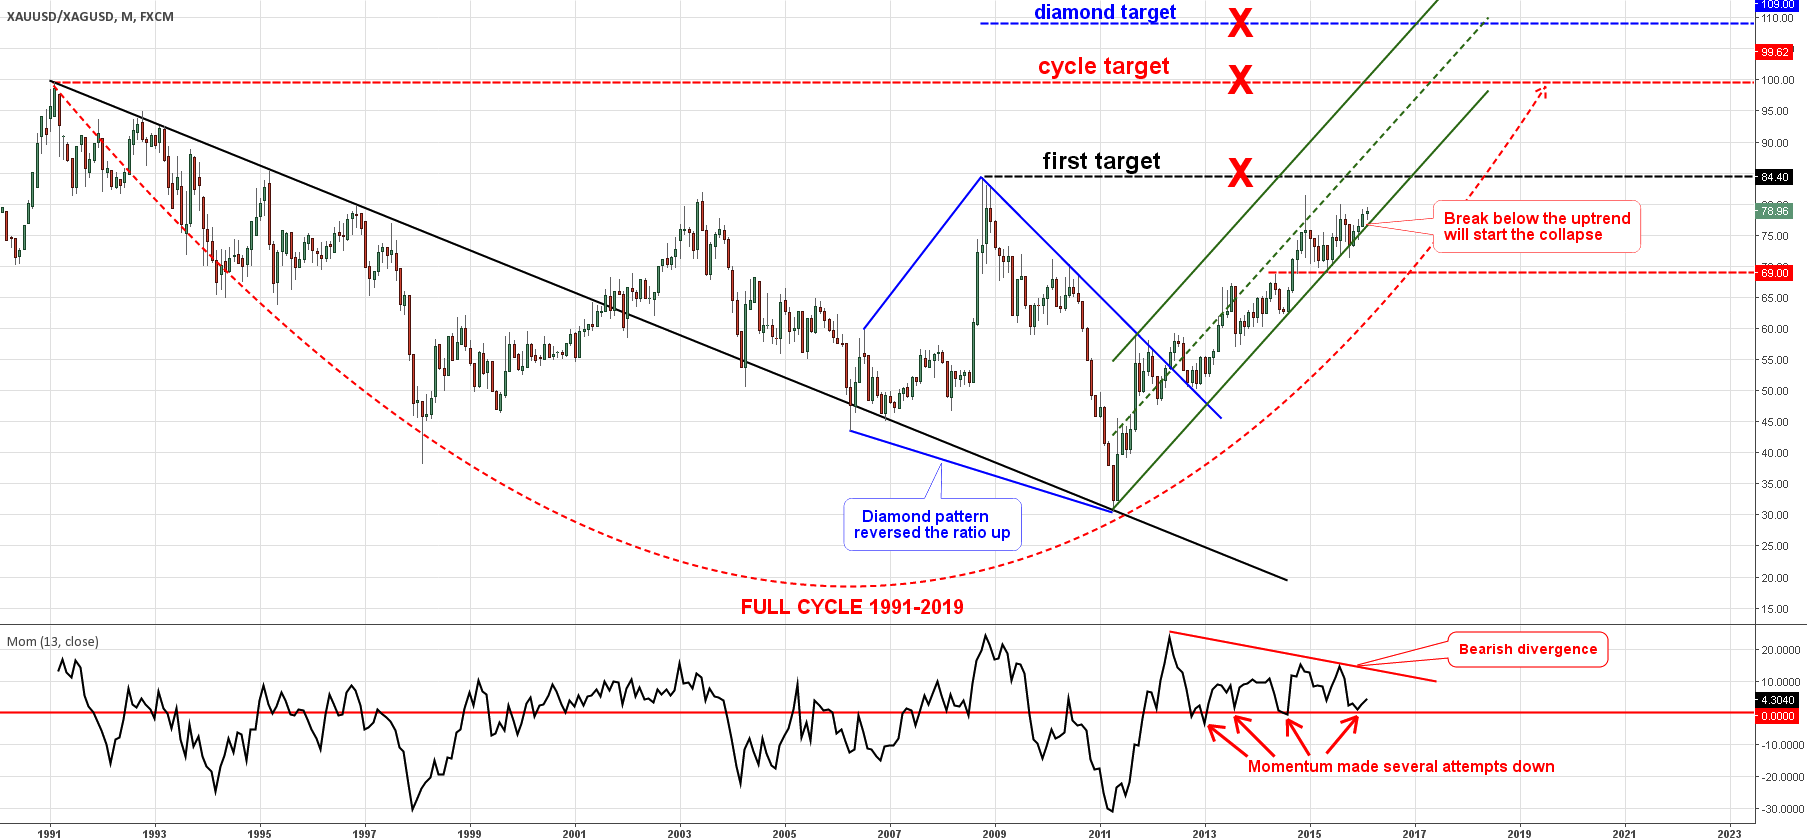
Back in August, I updated my gold/silver ratio chart with conservative bullish targets. Today I would like to share my growing concerns about the ratio's dynamics as fresh highs haven't appeared since my first post. As I've said many times before, let us not to be biased. Change the charting when the chart changes!

Chart 1. Gold/Silver Monthly: Tarnished Diamond

Monthly Chart of Gold/Silver
Chart courtesy of tradingview.com

Above is the reconstruction of the chart from the previous post about the ratio. I added several remarks in red the call-outs and also put the middle of the green channel in a dashed line. But the most important addition is the simple, classic Momentum indicator below the chart with remarks. Continue reading "Gold/Silver Ratio: Gold Loses Its Shine"