Gold/Silver Ratio Shows S&P 500 Is On The Edge

It’s time to update the S&P 500 index chart as it emerged inch-perfect since the last update in July.

SP500 Weekly Chart

Source: TradingView

To refresh your memory, I kept the main paths untouched and added new crucial highlights.

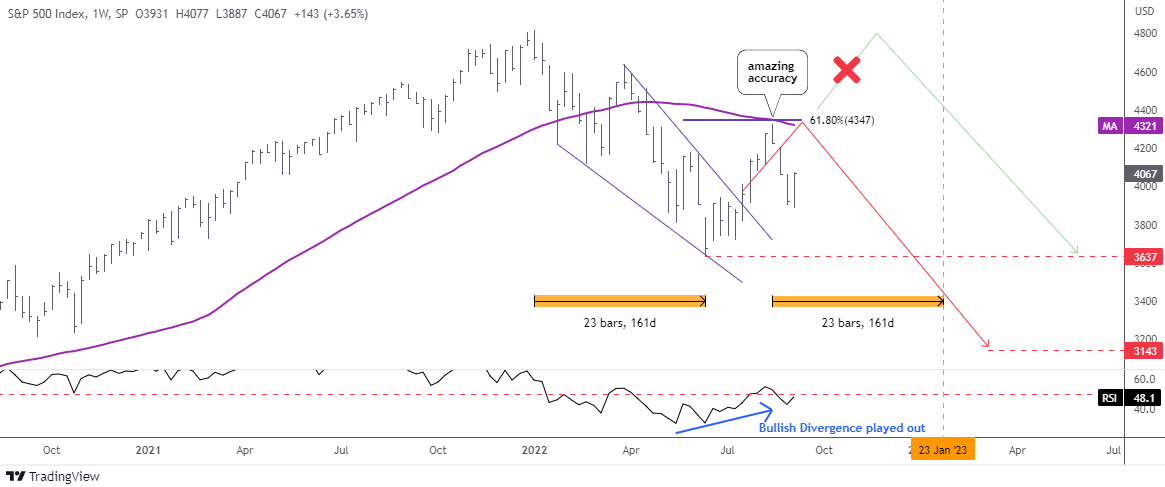
The idea of the upcoming breakout of the Falling Wedge pattern (blue converging trendlines) was posted right on time on the Blog as it played out instantly. Indeed, the Bullish Divergence of the RSI indicator with the price chart played out as planned supporting the breakup of the pattern’s resistance.

The majority of readers got it right choosing the red path as a primary scenario. The price action has been amazingly accurate in the 61.8% Fibonacci retracement area where the price failed to overcome the barrier and reversed to the downside from the minor top of $4,325 following the red zigzag.

I added the 52-week simple moving average (purple) to show you how strong the double resistance was at the $4,347-$4,349 level.

The next support is located in the valley in June at $3,637. Continue reading "Gold/Silver Ratio Shows S&P 500 Is On The Edge"

Gold, Silver, Gold/Silver Ratio & HUI

Precious metals are still locked down. With an understanding that there is always much more in play than nominal charts (the macro & sector fundamentals for example, which bounced of late but never did definitively flip positive), let’s review said nominal charts of gold, silver, and HUI along with an update of the Gold/Silver ratio for good measure.

Meanwhile, we will continue to update the full spectrum of considerations for a positive view of the precious metals complex, including gold’s standing vs. cyclical, risk-on markets/assets, the state of speculative vs. quality credit spreads, the inflationary backdrop (despite promotions to the contrary, cyclical inflation is not beneficial to the gold mining industry), the seasonal averages and the charts of the metals and miners over various time frames in NFTRH.

Gold

The daily chart shows the gold price (futures) below the moving averages but above short-term support after failing – amid much personally observed cheerleading to the contrary – to cross the bull gateway at 1920.

As a side note, the broken blue downtrend channel on this daily chart is actually the Handle to a large and bullish big picture Cup that only has one thing going against it that I can see; too much exposure by too many TAs, which of course means it may not be expressed until many of those TAs recant their stories (we have noted all along that the Handle can drop all the way to the 1500s without damaging the 2022 bullish Cup story. Indeed, if it were to happen (not predicting folks, but being prepared) it would be healthy. There is nothing healthier than a good running of the bugs before a major bull move. Continue reading "Gold, Silver, Gold/Silver Ratio & HUI"

US Dollar On Plan, Attended By Gold/Silver Ratio

US dollar (DXY) has activated its Inverted H&S, Gold/Silver maintains its uptrend, watch silver going forward…

I do not make predictions because I do not pretend to be a guru.* But NFTRH has been tracking what has been an uptrend in the US dollar for all of 2021, keeping us well aware of the potentials being realized from late summer into the fall. A higher low was made in May and now a higher high, completing an Inverted Head & Shoulders pattern that we’ve been projecting since USD put in the theoretical right side shoulder last spring.

Until recently it was a projection. Now it is active after testing the (dashed) neckline, holding the (blue) 50-day average and busting to a new high for the cycle. Simple, no predictions but a heck of a lot of attention and respect for the process.

You can see the three targets we’ve had laid out for the world’s reserve currency, which has logically caused market stress of late. It’s as simple as ‘you live (pump markets) by devaluing the currency, you die (markets correct) when it rebels. Now if the rebellion does not become something more than moderate and should end at target #1, we’ll probably go back to our regularly scheduled programming of pervasive inflation problems on the macro.

As you can see, the three targets are Fibonacci retrace levels. All doable depending on how aggressively risk goes off and man and machine seek liquidity (as opposed to market speculation) in the near term. Of note, the pattern itself has a theoretical measured target of 97. Again, not a prediction but now that the pattern is active a viable objective.

us dollar (dxy)

And speaking of liquidity, the issue is compounded when USD’s fellow Horseman (of the Apocalypse) is riding alongside. Continue reading "US Dollar On Plan, Attended By Gold/Silver Ratio"

Can The Silver Bugs Alter The Macro?

As to the post’s title, they sure are trying. Despite doubts that the stodgy old likes of me may have.

Silver

But for two days at least dem bugz is successfully battlin’ dem boyz on da COMEX. The result is that the Silver/Gold ratio (weekly futures chart) has been rammed to a new high for the post-crash move. If we back completely away from the #silversqueeze punchbowl, this is an indicator guiding the way for forward inflation.

silver gold ratio

So again, can the silver bugs alter the macro? Are the silver bugs altering the macro or is silver just doing what it has been technically capable of doing all along? Since well before #silversqueeze (a ‘me too!’ operation to the famous Reddit plays of late) was promoted by its originator, gold had been trending down vs. silver. Continue reading "Can The Silver Bugs Alter The Macro?"

Gold Miners: Beautiful Pictures

After a well-deserved correction of nearly 3 months, the gold stock sector is still flashing positive signs beneath the surface, as the correction matures.

The correction that began in August amid the ‘Buffett Buys a Gold Stock!‘ tout has now ground on for nearly 3 months. As noted in the NFTRH 626 Opening Notes segment:

“Thus far the correction in gold, silver and the miners is perfect, where perfection means long, drawn out and maddeningly frustrating to bulls (and bears thus far). That’s what corrections are, remedies to excitement, confidence and of course, greed.”

We are managing the technical details (and associated strategies) of the correction in HUI and individual gold stocks each week in NFTRH, but as a gold stock investor, it has not been a time for making money since August. As a trader, it has been a difficult time for making money as well, because of the lack of a definitive drop that the sector’s corrections are known for. It has been a grind, and in that annoying, time-consuming process, it has been perfect.

Below are some pictures that we have maintained front and center during the correction in order to disqualify or more likely, confirm the macro bull view for gold and the miners. This was so that subscribers could sell, buy or hold as they see fit, but more importantly so that we could know the status of the backdrop all along the way to make better-informed decisions.

Meanwhile, the perfection has been in the cleaning of the investor base, a large portion of which thinks that inflation is good for gold miners. Often it is for the stock prices, but rarely is it good for the bedrock sector fundamentals. One of the best measures of the real price of gold is the Gold/CRB ratio, which is in part of the measure of the gold mining product vs. gold mining costs, especially energy costs. Continue reading "Gold Miners: Beautiful Pictures"