Chart to Watch - Facebook (FB)

We've asked our friend Jim Robinson of profittrading.com to provide his expert analysis of charts to our readers. Each week he'll be analyzing a different chart using the Trade Triangles and his experience.

Today he is going to take a look at the technical picture of the Facebook (NASDAQ:FB).

I hope you are having a GREAT week !

When trading stocks with the MarketClub system we use the monthly MarketClub Trade Triangle to tell the trend and the weekly MarketClub Trade Triangle to time the entry and exit points. Continue reading "Chart to Watch - Facebook (FB)"

A New Way To Look At Netflix

It has been a little over 11 months since the first major buy signal in Netflix (NASDAQ:NFLX) at $84.95 on December 4, 2012. I have remained bullish on the stock since that time, which turned out to be one of the best trades for the year so far.

Today I would like to share with you how to use the Relative Strength Index (RSI) to enter a position in any up-trending stock. When a stock pulls back, it is difficult to know how far that stock will fall. This is where the RSI comes in and can be an enormous help. When the indicator moves over 70, it is considered overbought and conversely when the indicator moves below 30, it is considered oversold. This was the original thesis of Welles Wilder when he developed the RSI back in the mid-70s. Later it was discovered that when a stock pulls back to the midpoint of 50 or just below, it actually finds support.

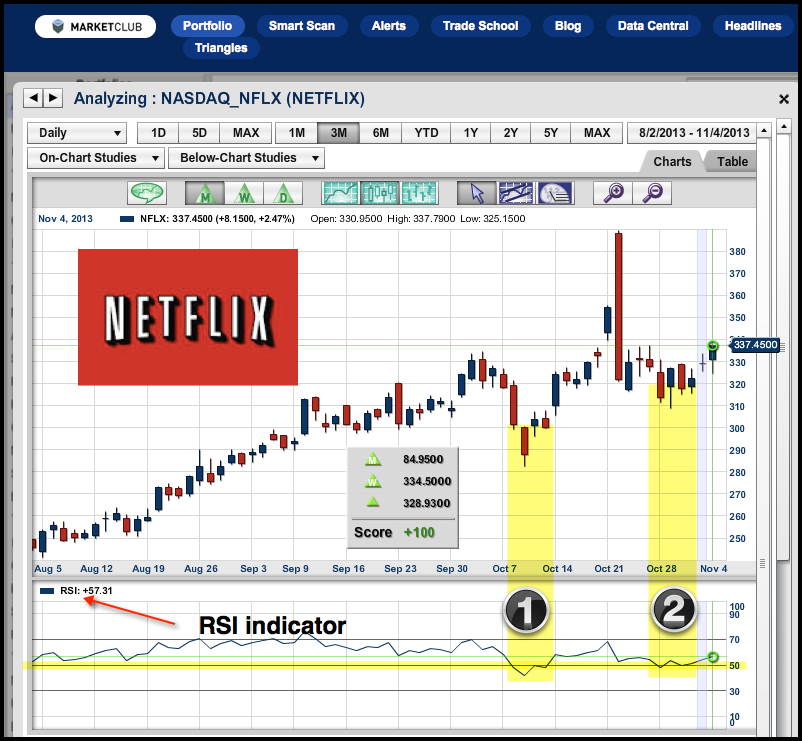
In my Netflix (NASDAQ:NFLX) example, I have highlighted both the price and the RSI support in yellow. The horizontal line at 50 on the indicator is also highlighted in yellow. As you can see on the chart, Netflix fell back to support twice during the last four months. Each time the RSI touched or moved just below the 50 line, it found support and made a strong recovery rally.

Yesterday, November 4th, Netflix (NASDAQ:NFLX) had its second highest close for the year. With all of the Trade Triangles positive on this stock, plus it has just come from an RSI support area (number 2), I expect to see this stock trend higher in the weeks ahead.

The moral of this post is, whenever you see a strong uptrend, you might want to check out the Relative Strength Index (RSI) for a low-risk entry point.

Adam Hewison
President, INO.com
Co-Creator, MarketClub

Chart to Watch - Cotton

We've asked our friend Jim Robinson of profittrading.com to provide his expert analysis of charts to our readers. Each week he'll be analyzing a different chart using the Trade Triangles and his experience.

Today he is going to take a look at the technical picture of the December Natural Gas Futures (NYMEX:TT.Z13.E).

I hope you are having a GREAT week !

Cotton has made a breakout of support and there is a good chance Cotton will continue lower from here.

All three MarketClub Trade Triangles are pointing to lower prices right now, so we would want to sell Cotton on pull backs with the MarketClub system. Continue reading "Chart to Watch - Cotton"

5 Stocks To Exit Immediately!

One of my all-time favorite songs is from the Kenny Rogers album, "The Gambler" and every investor can learn something from the song's lyrics.

"If you're gonna play the game, boy, ya gotta learn to play it right.
You got to know when to hold 'em, know when to fold 'em,
Know when to walk away and know when to run.
You never count your money when you're sittin' at the table.
There'll be time enough for countin' when the dealin's done."

Here we are 34 years later and the words to that song are every bit as relevant as when they were written. When stocks go up, "you got to know when to hold 'em", and when stocks go south you have to "know when to fold 'em." The words to the song are very simple, but they are, in fact, the essence to successful trading. Continue reading "5 Stocks To Exit Immediately!"

Amazon beefs Up For Q4, Are You Buying?

Amazon(NASDAQ:AMZN), the world's largest online retailer just announced that is hiring 70,000 new employees for Q4 and I see this as a big positive for this stock. I have been positive on Amazon for some time now, but I see this fourth-quarter as being a potential (knock it out of the park) quarter for this company.

I recently purchased some bicycle parts from Amazon, and as usual Amazon delivered, as promised, on time, and the parts were perfect. I'm not sure how it is with your friends and family, but it seems that all of my family and friends order from Amazon.

Millions of people purchase from Amazon(NASDAQ:AMZN) over the course of the year, and that trend isn't likely to slow down anytime soon unless there is a major Black Swan catastrophe. Why do so many of us love doing business with Amazon? My belief is because Amazon, like Apple makes it so easy to enjoy their products and services.

Okay, now let's take a look at the chart and the technical picture for Amazon(NASDAQ:AMZN). The most important technical element is that all of the Trade Triangles are in a positive mode, indicating higher prices to come.

Now let's take a look at what has happened in the recent past. There is an old Hungarian proverb, "The past is the teacher of the future". Looking back, you can see that Amazon made an important cyclic low back in the Nov/ Dec period last year. From that cyclic low of $219, the market rallied to reach a high of $284, which represents a $65 swing from low to high (see first orange arrow on the chart). Continue reading "Amazon beefs Up For Q4, Are You Buying?"