

Dear INO.com Readers,
Today, I'm reviewing three metals based on short-term analysis.
Copper Is A Good Sell
In my January post, I recommended selling copper above $2.75 and I hope you enjoyed a nice profit. For those of you who didn’t take that chance, below is my new one for you.
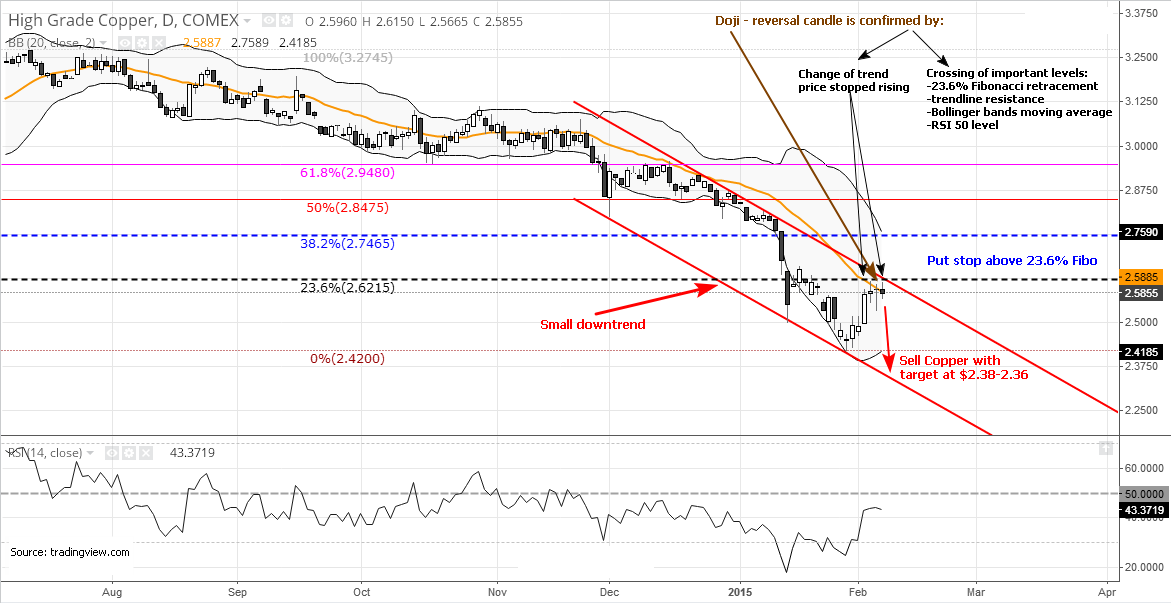
In December, copper entered a small steeper downtrend (highlighted in red) as the falling price accelerated. After breaking below the descending triangle’s base at $3.02 on the monthly charts, this red metal hit a multi-year low at $2.42, unseen from 2009, losing an impressive 20% in just 2 months. The price met the downside of the channel and quickly bounced off for a $0.20 gain and I will show why you should consider it a dead cat bounce. I highlighted in brown what is starting to be a frequent visitor "doji" candle, small, bodiless, but very powerful, showing that the market is indecisive. For a doji to have power, it needs to be confirmed by other strong technical elements. First of all, the top doji should really be between a rising candle and a falling candle to show a reversal and we can see that on the chart above. Also, we have the following technical confirmations at the level where the doji was shaped: 23.6% Fibonacci retracement (highlighted in black dashed line) stopped the price; the falling trend’s upside is also here; 20-day moving average of Bollinger bands (highlighted in orange) is right above the doji’s thin body and the final shot is by the RSI, which couldn’t break above the critical 50 level (highlighted in grey dashed line).
From this strong technical outlook, you can take a chance to sell copper at its current level ($2.5725), with quite a conservative target at the trend’s projected downside, located at the $2.38-2.36 level. And don’t forget to put a stop above the 23.6% Fibonacci level ($2.63). Risk is 2.2%, reward is, at minimum 7.5% ($2.38), a sound proportion!
Gold Is Pulling Back To Breakout
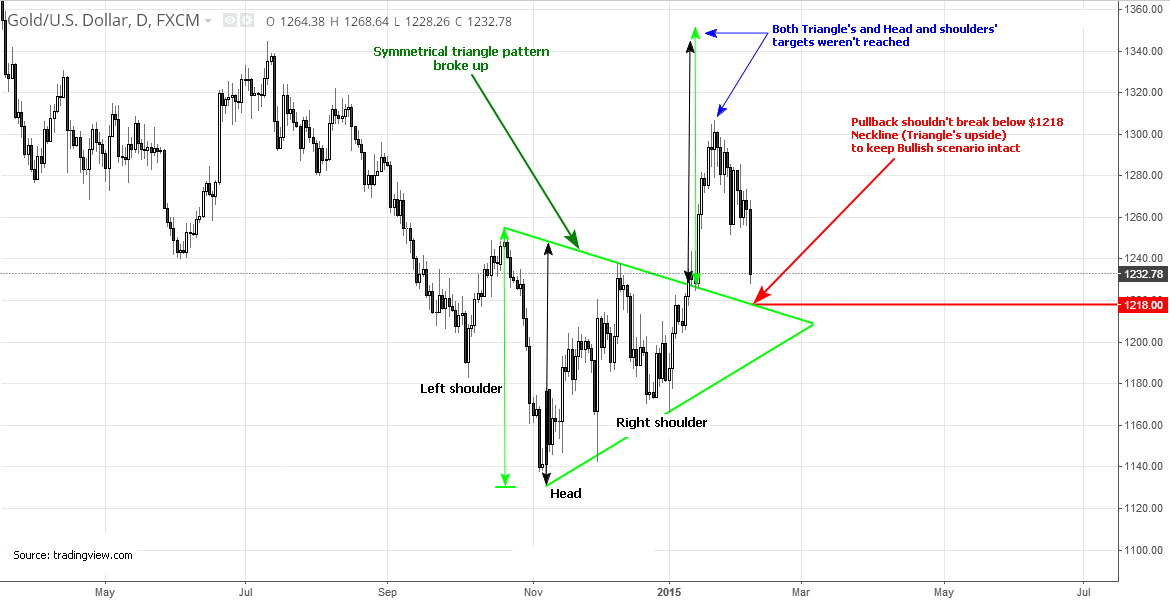
Gold is not good for trading these days as we can see the only pullback is from the recent breakout from both the symmetrical triangle and head and shoulders’ neckline. You can clearly see here that targets are not always reached. For example, $1340-1350 was aimed at, but the price lost momentum just after penetrating $1300; the bulls are still not strong enough. In my January post dedicated to gold, on monthly chart I recommended you wait until the small wedge would break above $1330, now you can witness yourself that trading based on forecasting is less reliable than that one based on clear break signals. Those who bought ahead of the break are in the red now.
The pullback looks impressive, but you shouldn’t be afraid of it as long as it’s a healthy technical move when the market retraces to the break point to generate enough momentum for a further move up until it’s just a retracement, not the destruction of the model.
Wait and see or pray if you are bullish, if price stays above the triangle/neckline support located at $1218.
Gold/Silver Ratio: Hold Until Break Up
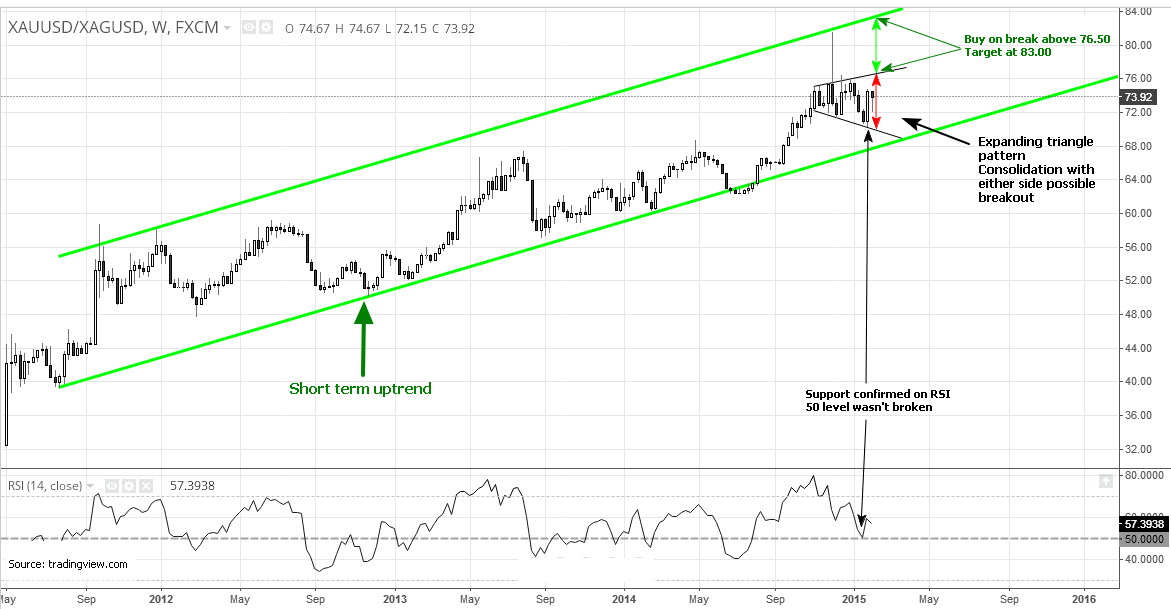
In my December post I showed you how far (109 oz) this ratio can rocket from a breakout of the beautiful “Diamond” pattern. It was at the 72 oz level, now we have reached 74 oz, not a big gain so far, but please be patient. This move today is under the microscope in the weekly time frame, bound in green short term uptrend. From this perspective, the market looks sidelined within a rare “reverse symmetrical triangle” or so called “expanding triangle” pattern (highlighted with black trend lines) and has lasted for 3 months already and I guess it should get relief soon. Two weeks ago, the ratio touched the downside at the 70 oz level and both support and the RSI 50 level kept unsullied and sent the ratio like a rocket to an almost 75 oz high. Three weeks of slow fall were erased in a single candle. To benefit from this pattern, you should be patient and wait until the upside breaks above the 76.5 oz level, with a target at the 83 oz level, calculated from the width of the triangle (6.5 oz; highlighted in red double arrow) added to the breakout 76.5 oz level. Stop the trade below 74.5 oz., 2 oz vs 6.5 oz as risk/reward proportion.
Lucky and Intelligent Trades!
Aibek Burabayev
INO.com Contributor, Metals
Disclosure: This contributor has no positions in any stocks mentioned in this article. This article is the opinion of the contributor themselves. The above is a matter of opinion provided for general information purposes only and is not intended as investment advice. This contributor is not receiving compensation (other than from INO.com) for their opinion.
This was a very well done analysis. I look forward to reading more my friend.
Dear Rainer,
I appreciate your warm feedback.
Hope to keep my best for you.
Take care, Aibek