

Silver has overshot the target set at the $20 mark in my June post leaving the gold in the dust. The AB/CD concept is simple yet effective as it utilizes perpetual Fibonacci ratios.
Ok, that’s done, but what is next? Let’s look at the charts below. I put the monthly chart first to refresh the global outlook for the soaring metal.
Chart 1. Silver Monthly: The Game Just Started!
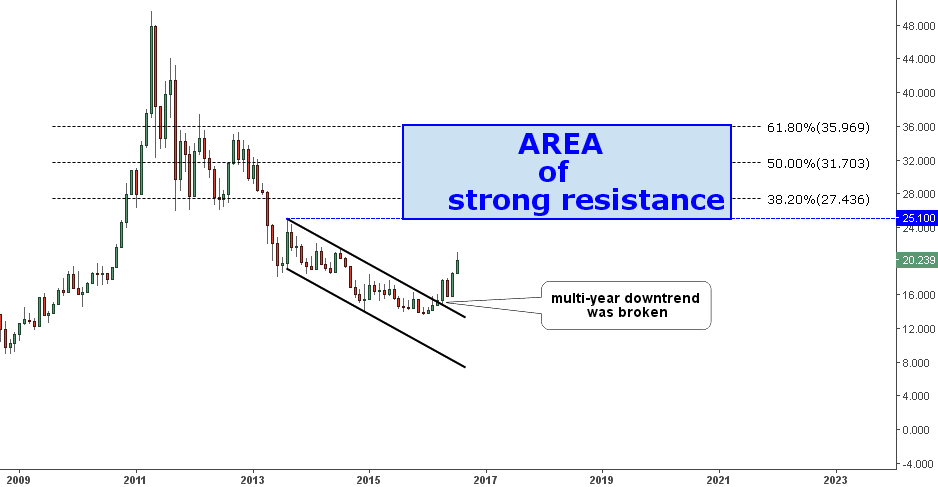
Chart courtesy of tradingview.com
The metal has finally shot above the black downtrend, which I was talking about in my March update. It was a vital need for silver to break loose from the multi-year grip to stop the drop.
The upside move was very clean from a technical point of view as the strong bullish April’s candlestick was followed by a pullback candle in May, which almost fully retraced the previous candlestick. Then, in June, the market has shaped a very strong bullish candle; if the price would close at the high, we could call it “Marubozu” – the candle without wicks, just with the body, indicating a strong trade in one direction. The current candle is also good for bulls as it has no wick below the body as the open equals to the low, which shows the strong bullish determination of the market.
The move to the upside just started as the main barriers are still ahead. We got a $10 area of several resistances on the upside (highlighted in blue rectangle). The first is the threshold of the black downtrend, which is located at the August 2013 high of $25.1. The next are resistances the Fibonacci retracement levels: $27.4 (38.2%), $31.7 (50%) and the $36 level (61.8%). All of these roadblocks can repel the bullish attack and we should watch closely after the price action around them.
Chart 2. Silver Daily: The Pennant!

Chart courtesy of tradingview.com
The daily chart above shows a very nice sharp angle of price advance relative to the angle of the orange support, which looks comparatively flat. Silver hit a new high last Monday at the $21.1 level amid Brexit nervousness. Then the market fell almost $2 into a consolidation to digest the upside jerk. The combination of lower highs and lows has shaped the “Pennant” pattern. This is the first time we have witnessed this figure in my charts. It’s a continuation pattern. The price has closed above the Pennant’s upside on Friday. If Monday the open is above it then the pattern would be confirmed. The target is a sum of the Pennant’s pole distance ($3.6) and the breakpoint ($20) and is equal to $23.6 as highlighted in blue on the chart above.
Please look at the RSI’s sub-chart. It has no sign of divergence with the price: higher highs and higher lows of the price have the confirmations on the RSI. It points at the continuation of the current trend. The RSI is above its orange uptrend and it has made a rattle-snake defensive posture before a fatal attack.
Intelligent trades!
Aibek Burabayev
INO.com Contributor, Metals
Disclosure: This contributor has no positions in any stocks mentioned in this article. This article is the opinion of the contributor themselves. The above is a matter of opinion provided for general information purposes only and is not intended as investment advice. This contributor is not receiving compensation (other than from INO.com) for their opinion.
With all the current global political, financial and civil uncertainties, I don't think so Klaus, you better load up, or you'll be left standing alone at the station.
I hope, the many LONGS will be burned - and Silver will go down a lot more than you are showing here.