In this post, I want to share a chart setup. This one has a bearish outlook as Canada Goose Holdings Inc. (NYSE:GOOS) is showing signs of further weakness.
Chart Canada Goose Daily: Market Is Going To “Pluck” It Again
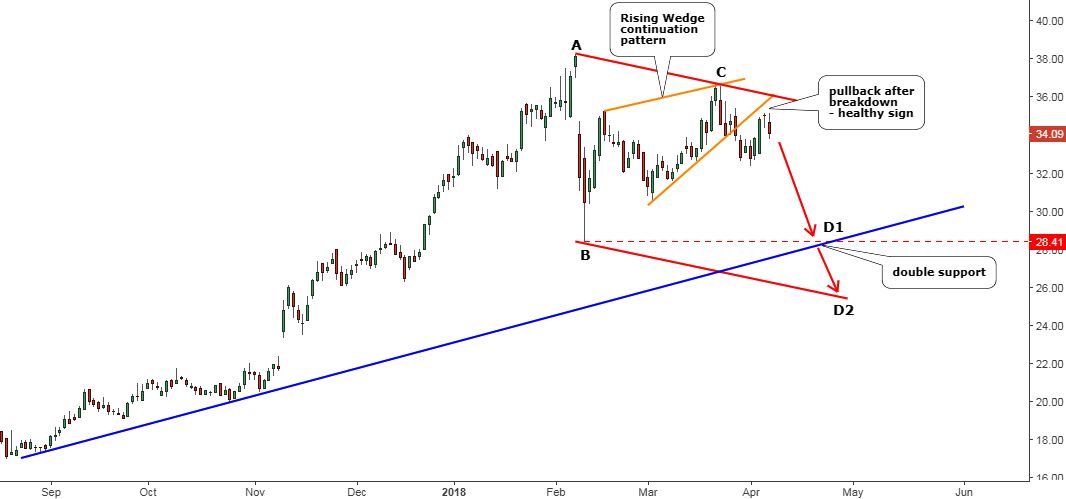
Chart courtesy of tradingview.com
So many times, investors fail in an attempt to predict the top or the bottom of the market. The chart of the Canada Goose can be used to show a textbook illustration of this phenomena as from the end of 2017 the price of this stock was making new high one after another until it reached the $38 mark in February. I guess that investors started to short GOOS from $26 and above as the all-time high streak persisted. Continue reading "Canada Goose To Be Plucked Again"