

Chart 1. Gold Daily: Second to Win but First to Hold
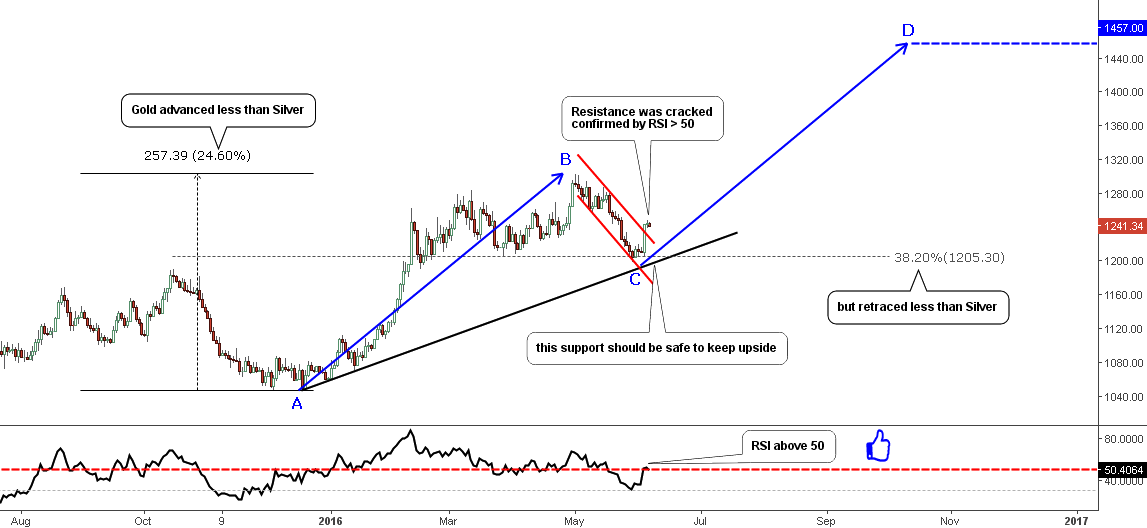
Chart courtesy of tradingview.com
The top metal has was just $4 from reaching the target of $1307 which was set in my March post. It had reached a high of $1303 on May 2nd before it started a one-month long correction anticipated in the same post. The depth of the correction is minimal at 38.2% and is well above the normal retracement area within the 50-78.6% range ($1176-$1101) highlighted in the March post.
Gold advanced for a hefty 24.6% from the December 2015 low, but it wasn’t enough to overcome silver’s amazing 32% progress. But on the other hand, the yellow metal has managed to hold its gains with minimum losses during the pullback – 38.2% vs. - 50% in the silver market.
In my previous post for these metals, I alerted you about the possible Flag pattern. Both metals couldn’t break up the potential flag resistance and continued down to the above-mentioned retracement levels.
I think that gold reversed at 38.2%, mostly because there is a black support line, just underneath which held the trend two times before and this time the market didn’t even try to check its strength.
The consolidation was contained within the red downtrend which was easily cracked last Friday by the single large daily candle amid a disastrous non-farm payroll (NFP) data. This move was confirmed with the RSI, which came above the important 50 level to indicate the end of downside correction.
As I said in my March post, we need the first move to the upside and the following retracement/pullback to project the next move up. The first move was labeled as an AB segment with a $257 gain. The projected move upside is labeled as CD segment and to keep a conservative approach I put the same length for it as the AB segment has. The target is located at $1457; it is just $26 below the 50% Fibonacci retracement area ($1920-$1046 downside move) – the first area of possible reversal downside (monthly charts). The move below $1190 would invalidate the setup.
Chart 2. Silver Daily: Paired Gains
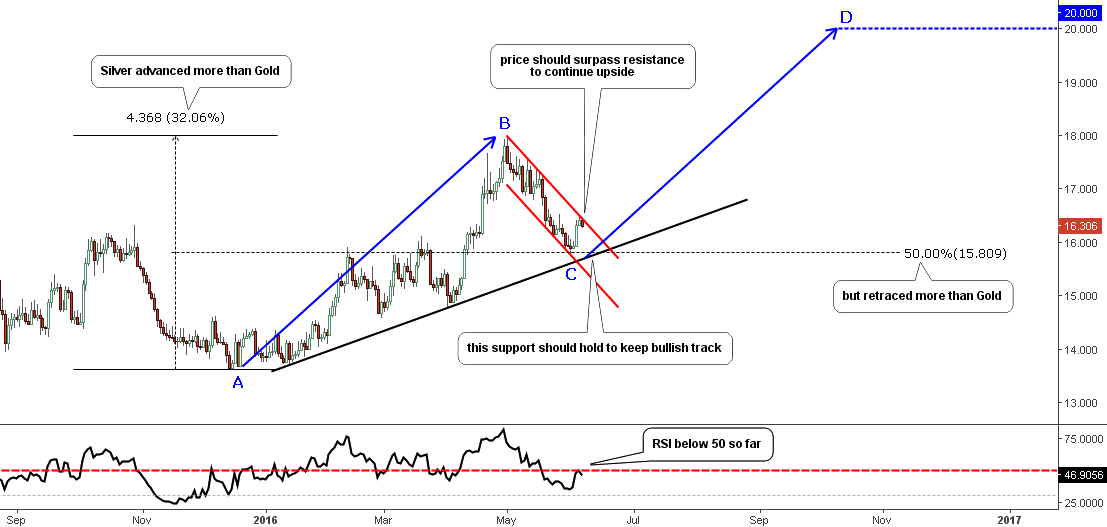
Chart courtesy of tradingview.com
The silver made a nice 32% gain from the December 2015 bottom overcoming gold and was just shy of ($17.99) the Cup & Handle pattern’s target at $18.23. Then it lost half of its gains at the pullback, again exceeding gold, but this time on the negative side. After correction, they both kept about a 16% gain pairing gains between each other. It looks like Mr. Market keeps them on the same lead.
The NFP report also lifted silver's price (better say killed the dollar everywhere), but it wasn’t enough to surpass the resistance of the red downtrend despite that gold succeeded there. The RSI also couldn’t come over an important 50 line at the first attempt last Friday. Here we see the divergence of these top metals with the luck on gold’s side, we all know from my earlier post that the central banks favor gold among other big players.
The good thing is that silver is like gold above the black support line, and if it keeps it safe then we will see a new high later on. The AB/CD concept applied to the current chart structure with the CD segment equal to the AB segment gives us the sweet target at $20.
The Intraday charts for both metals show a high possibility of a minor pullback before uptrend resumption. It is a normal market behavior as last Fridays move needs some consolidation to attract more bulls to the market.
Intelligent trades!
Aibek Burabayev
INO.com Contributor, Metals
Disclosure: This contributor has no positions in any stocks mentioned in this article. This article is the opinion of the contributor themselves. The above is a matter of opinion provided for general information purposes only and is not intended as investment advice. This contributor is not receiving compensation (other than from INO.com) for their opinion.
Typo. The next top, not time, if gold is able to take out $1303.
Wouldn't this be a little bit outdated since the chart reflected prices two days ago and gold has already broken the bull flag to the upside. The price projection of $1457 is very close to $1474, which is located on the opposite side (180 degree) of $1046, $1283 on Gann's Hexagon chart. And I have to agree with you that if gold could manage to surpass $1303 in coming days, weeks, the next stop or top is most likely to come in close to $1457. Actually, two price point we should pay attention to is $1410 and $1474. The former is 720 degree to $1046, while the latter is 900 degree to $1046 on Gann's Hexagon chart. While you don't have a time projection on th next top, my chart indicates August 4 would be an ideal date for the next time if gold is able to take out $1303.
Dear Kenny,
Thank you for sharing your valuable calculations with us!
Yes, I agree that digits and proportions are making amazing confluences in Fibonacci, Hexagon or clone types of analysis.
Best wishes!
Aibek