
2020 has kicked off, and it is time to see where the earlier Pendulum swing #8 has stopped to check if it worked properly. To remind you, we had pitted gasoline against natural gas and below are your bets for that experiment.
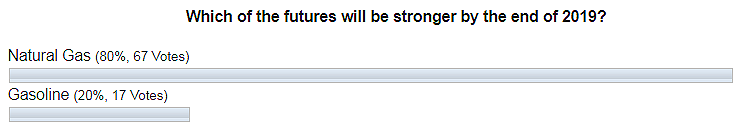
Bingo! The majority of you bet it right choosing Natural gas as a winner, and as you can see in the next chart that it has lost 5.42% as gasoline has dropped more than 10% to top the losers’ camp. I want to express my gratitude to those who chose the experiment success option for your trust! So, after the earlier failure in the first half of 2019 (7th swing), the Pendulum experiment is back on a winning track! We got only 2 failures out of 8 experiments now. Let’s push it again and see what happens.
Half Year Futures Performance (Second Half Of 2019)
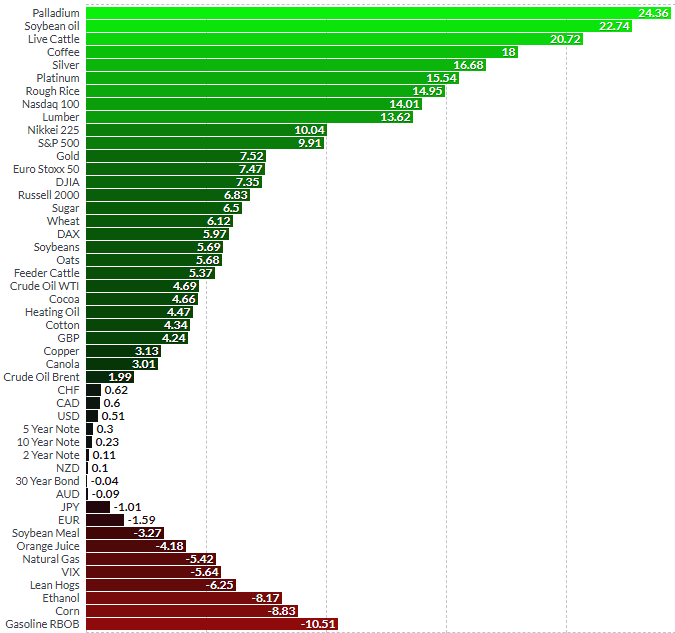
Chart courtesy of finviz.com
The regular champion and the buzz maker palladium has topped the chart again for the past half of the year as it scored the most with more than 24% gain. On the other side of the scorecard, there is the former champion gasoline, which failed to perform in the earlier contest.
It will be an interesting race as we put two former champions against each other, and if we would think abstractly – we pit green economy representative palladium, which helps to curb car emissions versus the gasoline, which is a player from traditional brick and mortar world.
The champion is first, so let’s look at Palladium futures daily chart below.
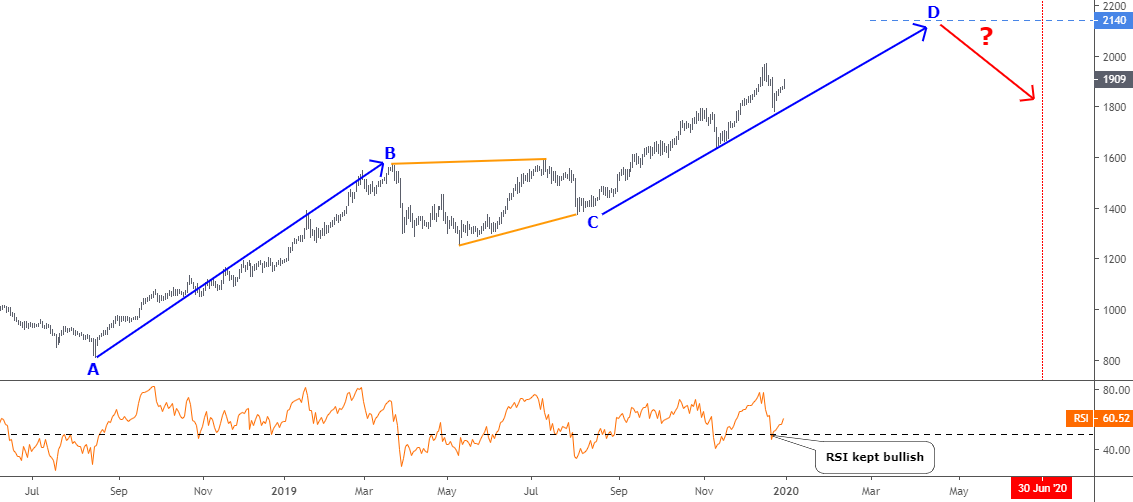
Chart courtesy of tradingview.com
The world can’t abandon gasoline engines quickly, even if everyone realizes the harm it makes as fully electric vehicles are yet to flood the planet. Palladium is the primary beneficiary of this situation as its price almost doubled in just seven months between August 2018 and March 2019. This period was labeled as the first upside AB segment (blue). Then there was a 5 month BC consolidation (orange trendlines). It couldn’t undermine the strong position of the metal much.
We are now in the final stage of the second leg up within the blue CD segment, which could hit a new historic record at $2140. This target will be reached once CD = AB. The RSI dipped with a small correction of the price and then reversed bouncing from the crucial 50 level. It remains bullish and supports the idea of further price growth.
This chart doesn’t portray this instrument as a future loser to prove the Pendulum effect, but as we can see, the deadline is located further than the price target, and the swing could still have time to take its effect then.
Now let’s get down to the underdog and see what the Gasoline futures daily chart shows us below.
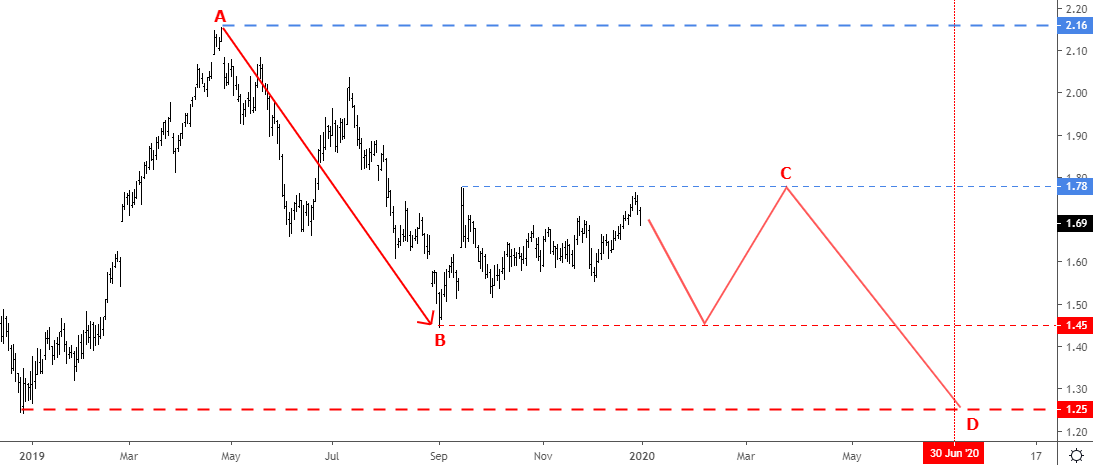
Chart courtesy of tradingview.com
The price of gasoline is fluctuating inside of a range set in a single month of September 2019 between $1.45 and $1.78. Recently we saw how price reversed ahead of the top of the range. It could revisit the former low of $1.45 to complete the junction within the BC consolidation. Then there could be another spike to the upside to finish the BC phase. After that, we could witness another drop-down within a CD segment to tag the lower side of the large range at $1.25. This target coincides with the deadline for this experiment and it’s not good for the gasoline futures.
The future is unpredictable as we never thought the ecology could be in danger. Anything could happen, and we should push the swing anyway, even if the answer looks obvious.
Intelligent trades!
Aibek Burabayev
INO.com Contributor, Metals
Disclosure: This contributor has no positions in any stocks mentioned in this article. This article is the opinion of the contributor themselves. The above is a matter of opinion provided for general information purposes only and is not intended as investment advice. This contributor is not receiving compensation (other than from INO.com) for their opinion.