Is Another All-Time High Ahead For Palladium?

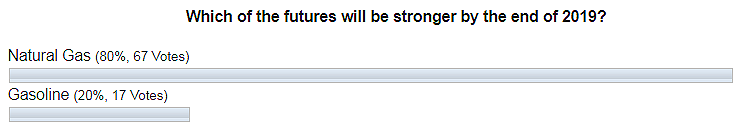
Before we start to analyze the mighty metal, I would like to mention that the crude oil futures Buy Setup was triggered last Friday as the futures price broke above $52.25. Please mind the risk if you trade and I wish you good luck there.

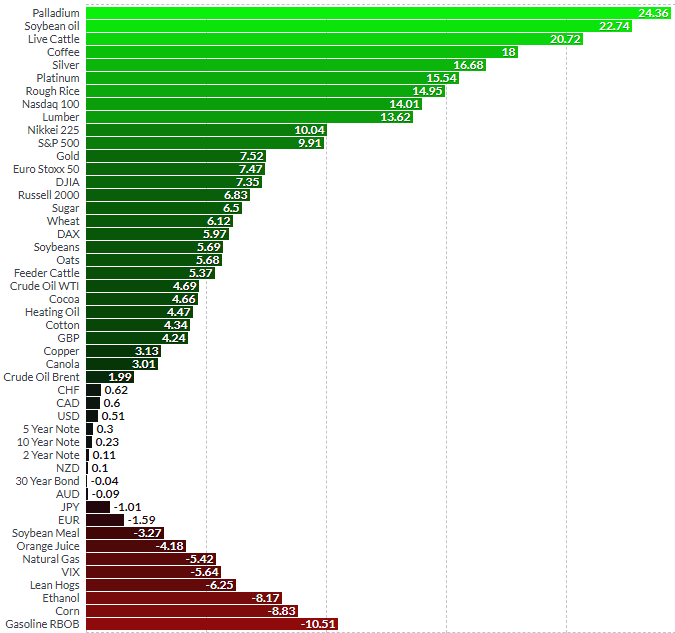
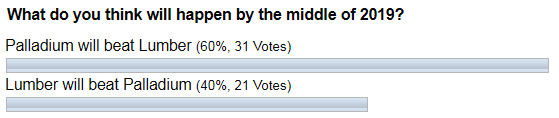
Now let’s get down to the metal. Earlier this year, we pushed a new Pendulum with regular champ palladium on board. Before you bet for Pendulum winner, I tailor charts for pitted instruments and so I did for palladium using the daily time frame. The outlook was quite ambitious as the bullish target was set at $2140 while the price was hovering around the $1900 level. The majority of you chose the former winner palladium as a new winner again against the logic of the experiment and I don’t blame this choice as this precious metal hits all charts amid strong demand. That target was reached within a week after the post had been published.

I detected a promising pattern on the daily palladium chart and I would like to share it with you as it still emerges.

Palladium
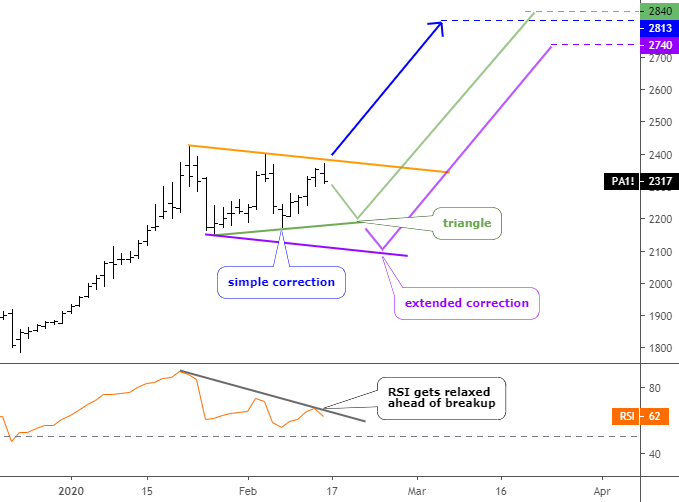
Chart courtesy of tradingview.com

Palladium futures hit the all-time high at $2427 on the 23rd of January. It’s quite natural that the correction followed as traders have booked profits after the price reached another record. Continue reading "Is Another All-Time High Ahead For Palladium?"

Pendulum Swing #9: Palladium Vs. Gasoline

2020 has kicked off, and it is time to see where the earlier Pendulum swing #8 has stopped to check if it worked properly. To remind you, we had pitted gasoline against natural gas and below are your bets for that experiment.

Gasoline

Bingo! The majority of you bet it right choosing Natural gas as a winner, and as you can see in the next chart that it has lost 5.42% as gasoline has dropped more than 10% to top the losers’ camp. I want to express my gratitude to those who chose the experiment success option for your trust! So, after the earlier failure in the first half of 2019 (7th swing), the Pendulum experiment is back on a winning track! We got only 2 failures out of 8 experiments now. Let’s push it again and see what happens.

Half Year Futures Performance (Second Half Of 2019)

Gasoline
Chart courtesy of finviz.com

The regular champion and the buzz maker palladium has topped the chart again for the past half of the year as it scored the most with more than 24% gain. On the other side of the scorecard, there is the former champion gasoline, which failed to perform in the earlier contest. Continue reading "Pendulum Swing #9: Palladium Vs. Gasoline"

Pendulum Swing #8: Gasoline Vs. Natural Gas

We have passed the middle of the year, so it’s time to announce the result of the 7th Pendulum swing pushed this January. The multiple winner Palladium and the earlier loser Lumber were put on the starting point at the beginning of this year.

Let’s see below which one you favored.

Gasoline Natural Gas

Most of you had bet that the metal would beat the forest product. And it appeared to be the right choice! This option was against the Pendulum effect as the lumber was thought to be the winner. I understand the majority’s decision as palladium was on the news as it hit the all-time high levels to become more precious than the gold amid insatiable demand.

The lumber futures chart implied the upcoming weakness after a retest of the broken support. The price has accurately followed that forecast making a pullback to the broken trendline support and then continued down.

Please look at the chart below, all in all, the invincible metal has scored 29% and hit the top of the chart again in the second place. The lumber futures are also in green as it gained 13%, but it was not enough to beat the palladium. The latter kept resistant to the Pendulum effect this time. Continue reading "Pendulum Swing #8: Gasoline Vs. Natural Gas"

Pendulum Swing No.6: Input Error

Another half of a year passed with a new year starting its track. It is time to see the result of the 6th Pendulum swing started in the middle of 2018. To remind you, we had pitted the VIX against sugar and below are your bets for that experiment.

Pendulum

You are the best readers I could only dream of as you support my experiment with your real votes for the success of it.

Let’s see which instrument won at the end of the year.

Chart 1. Half Year Futures Performance (Second Half Of 2018)

Pendulum
Chart courtesy of finviz.com

As we can see from this half-year, performance chart sugar couldn’t beat the VIX, which dominated the futures market by a huge margin throughout 2018. One can think that the experiment failed this time, but in my opinion, we have the wrong selection of one input. I am talking about the VIX. The thing is that the underlying asset of these futures is not a commodity, but the “Fear index” or the indicator of the risk approach. Continue reading "Pendulum Swing No.6: Input Error"

Pendulum Swing No.5: Back To Success!

It’s time to announce the result of the 5th Pendulum swing pushed this January. In that race, I put heating oil (ultimate futures winner in the second half of 2017) vs. wheat futures (the top loser). The Pendulum effect favored the top loser, i.e., wheat to beat heating oil in the six month period. The image below contains the poll results of your voting for that experiment.

Image 1. Poll results

CBOE Volatility Index (VIX)
Chart courtesy of INO.com

Bingo! The majority of you guessed right choosing wheat as a winner and as you can see in the next chart that wheat has gained +17.56% as heating oil gained only +6.76. I would like to express my gratitude to those who chose the experiment success option for your trust! So after the first failure in the second half of 2017 (4th swing), the Pendulum experiment is back on a winning track! Let’s try it again and see what happens.

Chart 1. Half Year Futures Performance (First Half of 2018)

CBOE Volatility Index (VIX)
Chart courtesy of finviz.com

This time we will have an interesting race as the winner in the first half of 2018 is not a commodity, but the CBOE Volatility Index (VIX) also known as the stock market fear gauge. It gained more than 40%, leaving its rivals far behind amid the roller-coaster ride in the S&P 500.

On the other side, which is red, there is the biggest loser, sugar with an almost 20% loss in the first half of 2018. The supply glut in the sugar market undermined the price for this commodity significantly. Continue reading "Pendulum Swing No.5: Back To Success!"