Has The FED Broken Inflation?

On Tuesday, July 5th, Crude Oil collapsed very sharply, down over 10% near the lows, in an aggressive breakdown of the price. The $97.43 lows reached that day were more than -14% from recent highs (set on June 29, 2022) and more than -21% from highs set on June 14, 2022.

Consumer Discretionary Spending Likely To Fall Further

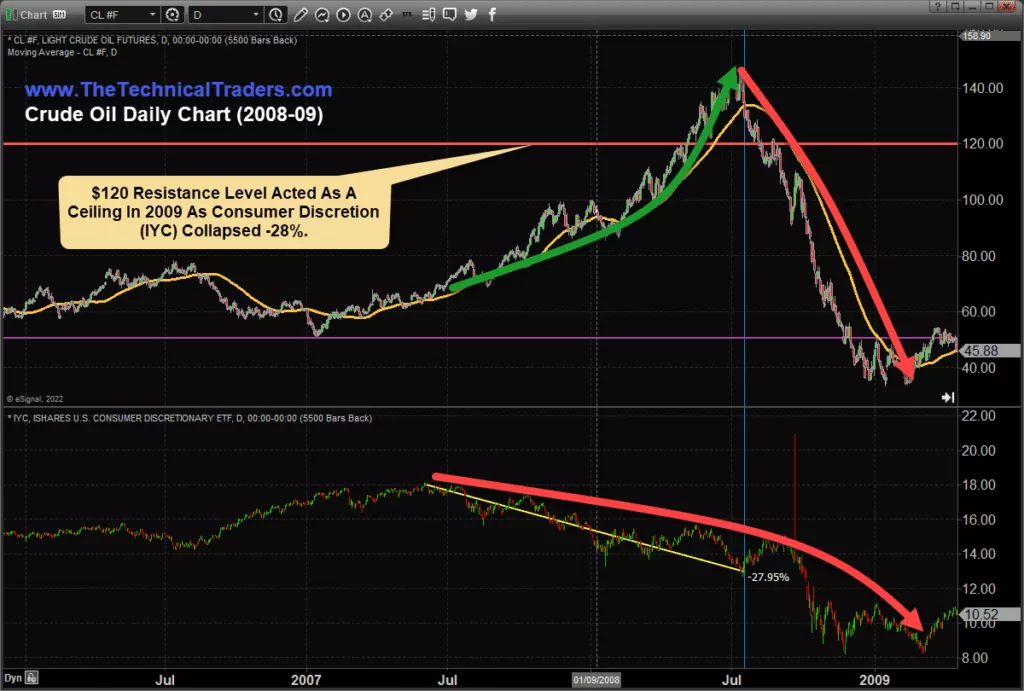
Recently, I shared a similar breakdown that took place in Crude Oil in 2009 and how tightening consumer spending often correlates with peaks in Crude Oil when crisis events happen.

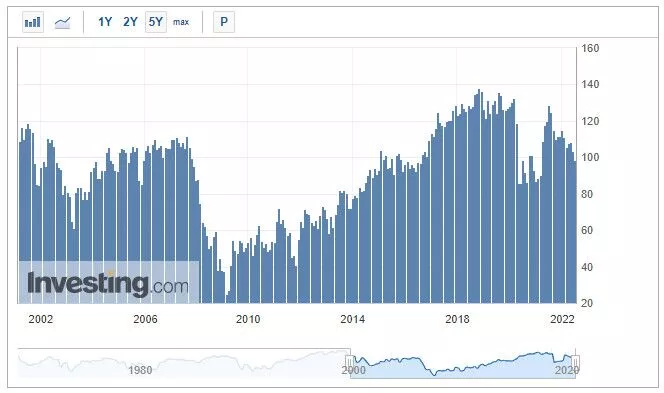
Within that research article, I shared this chart highlighting the collapse in the Consumer Discretionary sector that preceded the downward collapse in Crude Oil. The interesting facet of this chart is we can see the inflationary price pressure in Crude Oil (and the general economy) countered by pressures put on consumers in the lower IYC price chart.

Consumers Lead The Global Economy – Watch IYC Closely

As prices rise, consumers are put under extreme pressure to keep their normal standard of living. As inflationary pressures continue, consumers make necessary sacrifices to manage their budgets – often going into debt in the process.

Eventually, this cycle breaks, and inflationary trends end. This is clearly evident on the chart below in July 2008 – as IYC, the Consumer Discretionary sector, collapsed by more than 27% before Crude Oil finally peaked and broke downward.

Crude Oil Daily Chart

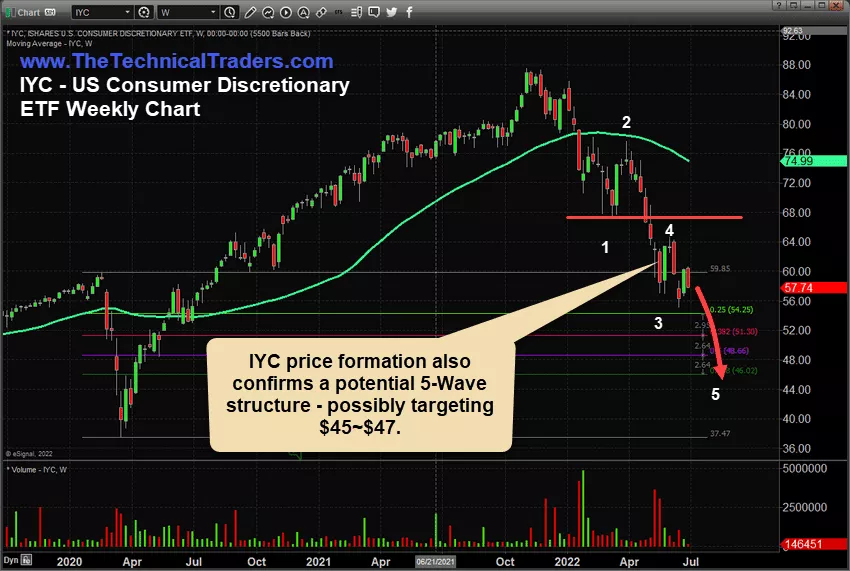
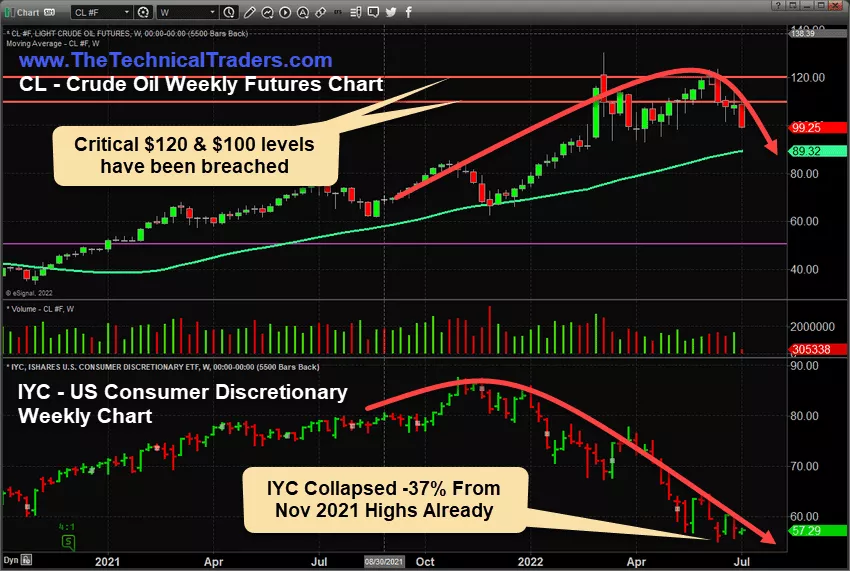
Since November 2021, IYC Has Fallen More Than -37%

This current Weekly Crude Oil & IYC Chart shows IYC has collapsed by more than -37% from the November 2021 highs – well beyond the -27% collapse in 2008 that preceded the 2008-09 Global Financial Crisis event. Is the current collapse in IYC a sign that a broad global crisis event has already begun to unfold beneath all the news and hype? Will Crude Oil collapse below $75ppb as the global economy shifts away from inflationary price trends and bubbles burst?

Crude Oil Daily Chart

The Deflationary Price Cycle Is Not Over Yet

If IYC falls below $55 in an aggressive downward price move, I would state the risks of a global deflationary price cycle (or extended recession) are still quite elevated. Currently, the $55 price level in IYC aligns with early 2019 price highs and reflects an extended price advance from the $12~$15 IYC price levels in 2008-09.

If the $55 IYC price level is breached to the downside, I expect the $37.50~$40.00 price level to become future support – as that price level reflects the COVID-19 event lows.

Still, these lower price targets represent an additional -32% decline in IYC and reflect a total of a -57% collapse in the Consumer Discretionary sector from the November 2021 peak levels. The potential target range of $37.50~$40.00 correlates with the 2008-09 GFC collapse range when IYC fell from $18 to lows near $8 (nearly -57%).

We are still very early in the shifting deflationary cycle phase after the US Fed started raising interest rates. Learn to protect and profit from this global event with my specialized investment solutions.

Learn more by visiting The Technical Traders!

Chris Vermeulen
Technical Traders Ltd.

Disclosure: This article is the opinion of the contributor themselves. The above is a matter of opinion provided for general information purposes only and is not intended as investment advice. This contributor is not receiving compensation for their opinion.

Consumers Are in a State of Shock

As the Fed continues to posture future rate increases to battle inflation, recent economic data shows consumers are in a state of shock as price factors continue to skyrocket. Food, gas, materials, etc have shot up in price over the past 24 months – with no end in sight.

Consumers Are Recoiling Away From Traditional Spending Habits

The natural reactions of consumers fall into two categories: Grow or Survive. This is similar to how plants and trees operate. In healthy environments, plants and trees enter a growth phase – flowering and prospering. In an unhealthy environment, plants and trees enter a survival phase – directing resources toward anything essential for survival.

Global inflation is putting pressure on central banks to thwart excesses in the markets after 8+ years of easy money policies and nearly 2+ years of COVID stimulus. Consumers thus seemed to have switched into Survival mode very quickly over the last 6+ months. This reaction could have very telling outcomes for global GDP and regional economies over the next 24+ months.

In August 2021, we published an article highlighting the shift in consumer activity. It brings attention to how important Consumers are to the overall health of the global economy.

Consumer Confidence Dips Below 100

After the 2008-09 GFC, Consumer Confidence took more than 5 years to rally back above the 100 level (in 2015). The 2015-16 range was a US Presidential election year cycle – which usually disrupts US economic activities a bit.

In early 2017, Consumer Confidence started to rally higher – eventually reaching a peak in October 2018 near 137.90. Historically, the only other time Consumer Confidence reached higher levels was in 1998-99 (DOT COM Peak).

U.S. CB Consumer Confidence

Source

IYC May Start A Wave-5 Downtrend – Targeting $45-47 As A Base

Traders should consider the broader scope of the market trends while attempting to understand the opportunities that will come by waiting out the risks of trying to buy into a falling market. The Fed has clearly stated they intend to continue raising rates to break the inflationary cycle. Consumers will reflect these new risks by moving further away from traditional spending habits (Survival Mode) while attempting to wait out the risks to the environment.

It appears IYC has formed a moderate Wave-4 peak, which is below the Wave-1 bottom. From a technical perspective, it appears IYC will attempt to move below the $47 level over the next few weeks – attempting to establish a new base/bottom.

IYC Weekly Chart

US Real Estate Showing Signs Of A Top

No matter how you slice the data, more homes are flooding the US markets right now. Sellers are trying to “cash-out” at sky-high prices. Yet, buyers are staying very cautious because of rising interest rates and borrowing costs. Price Reductions on listed homes have risen to the highest levels over the past 8+ years. Sellers with homes on the market longer are aiming to tempt buyers with a discount. The race to the bottom has started. The Fed is going to add more fuel to the declines with another rate increase.

Recent Mortgage Refinance Index data shows the current 726.1 print is the lowest level since July 2000. This means the purchase and refinance are the most unfavorable for buyers over the past 22+ years (not since the peak of the DOT COM bubble).

Mortgage Refinance Index

Source

A reversion of home prices is almost a certainty at this point. I suspect a surge of new foreclosures and slowing sales will compound with layoffs and other economic contraction trends to present a “perfect storm” type of reversion event.

IYR Targeting $70 to $75 As Assets Unwind

IYR is likely to continue trending lower, targeting $70 to $75, before finding any real support. The reversion of asset valuation levels is still very early in the process of the Fed attempting to battle inflation. Depending on how the global markets react to the overall economic environmental change, we could see an extended contraction in assets lasting well into 2023 – possibly into 2024.

Traders should stay cautious of trying to chase the falling market trends. Real opportunity for profits exits when the reversion event is complete and when opportunities for less volatile extended trends resume.

IYR Weekly Chart

Protective Patience May Be The Best Trader/Investor Attitude Right Now

The US markets are already down by more than -25% overall. Any extended decline from current levels could push many traders/investors into a crisis. When the bottom sets up and is confirmed, we’ll begin to allocate capital back into sector trends. In the meantime, we avoid this massive drawdown event by waiting on the sidelines and being ready to deploy capital.

My strategies pulled capital out of the markets very early in 2022. Since then we have been sitting in CASH as a protective market stance while the global markets continued to decline. Protecting capital is the first rule for any trader/investor. Learning when to trade and when to be patient should be rule #2.

As Consumer Confidence continues to decline, Consumers have moved into a protective/patient (Survival) mode. Traders and Investors should consider the longer-term risks of not adopting a similar stance right now.

Learn more by visiting The Technical Traders!

Chris Vermeulen
Technical Traders Ltd.

Disclosure: This article is the opinion of the contributor themselves. The above is a matter of opinion provided for general information purposes only and is not intended as investment advice. This contributor is not receiving compensation for their opinion.

Financial Sector May Rally 11% - 15% Higher

The financial sector is poised for a very strong rally into the end of 2021 and early 2022 as revenues and earnings for Q4:2021 should continue to drive an upward price trend. The US Federal Reserve is keeping interest rates low. At the same time, the US consumer continues to drive home purchases and holiday shopping. Strong economic data should drive Q4 results for the financial sector close to levels we saw in Q3:2021. If that happens, we may see a robust rally in the US Financial sector over the next 45 to 60+ days.

The strength of the recent rally in the US major indexes shows just how powerful the bullish trend bias is right now. Some traders focus on the downside risks associated with the US Federal Reserve actions and/or the concerns related to inflation and global markets. I, however, continue to focus on the strength in the US major indexes and various sector trends that show real opportunities for profits.

Comparing Sector Strength

The following two US market sector charts highlight the performance over the last 12 vs. 24 months. I want readers to pay attention to how flat the Financial Sector has stayed since just before the 2020 COVID event and how the Financial Sector has started to trend higher over the past 12 months. This is because the shock of COVID briefly disrupted consumer activity. Yet, consumers are coming back strong, driving retail sales, home sales, and the continued strong US economic data. Therefore, it makes sense that the Financial sector should continue to show firm revenue and earnings growth while the US consumer is active and spending. Continue reading "Financial Sector May Rally 11% - 15% Higher"

Which Market Trends Will Drive Through To 2022?

Some interesting facts related to market trends and the global economy have come into play recently. After the COVID-19 virus event began, global central banks entered a phase of extended easing. This move was an attempt to transition through the economic concerns related to the immediate shutdown caused by COVID-19. These actions have translated into a new phase of market trending where the Consumer became hyper-active in the global economy while inflationary trends were somewhat muted.

COVID Shifts Global Cycles Faster and Broader Trends

Now that inflation is starting to rise, we may transition away from consumer and speculative market cycles. Over the next 6 to 12+ months, the markets may shift into a late-stage Bullish rally phase. My opinion is the COVID-19 virus and economic event process has resulted in a speedy, possibly 24 to 36 month, extreme cycle phase.

Take a quick look at the Stock Market & Economic Performance cycle example below. We can see that Financials/Transports, Technology, and Capital Goods usually lead a market rally after a bottom in cycle trends. This trend is generally followed by a rally in Basic Industry, Precious Metals, and Energy before we near a peak level in the stock market. Continue reading "Which Market Trends Will Drive Through To 2022?"

Is Zillow's Collapse A Warning Sign? - Part 2

In part one of this article, we discussed how the recent decline in Zillow, Redfin, and Opendoor share prices could reflect a concern that the risks involved in holding large home inventories while attempting to "flip houses" could present for these Real Estate firms. The recent 50% price drop in the share price levels should send a fairly strong warning to investors that these "flipping" processes contain a moderate degree of underlying risk and extended costs in a super-heated and potentially peaking Real Estate trend.

It has been reported that Zillow increased the purchase of homes for their Ibuyer program, from 86 homes in Q2:2020 to 808 homes in Q3:2020, to 3805 homes in Q2:2021. We’ll learn more about their Q3:2021 home buying efforts when Zillow announced earnings.

It has also been reported that Zillow sold more than $1 billion in bonds to investors to fund this operation that includes using their Zestimate algorithm to buy homes quickly, renovate/flip them, and put them back on the market. The super-heated Real Estate market has driven these firms into speculative trading of houses in an open and often hostile market environment. Taking a bigger leap is Opendoor, which purchased 8,494 homes in Q2:2021. This is a massive inventory of homes that may require many months or years to renovate/sell.

Zillow Collapse

Is this trend a buying opportunity for Zillow, Redfin, and Opendoor – or a warning? Continue reading "Is Zillow's Collapse A Warning Sign? - Part 2"