Weekly Futures Recap With Mike Seery

We've asked Michael Seery of SEERYFUTURES.COM to give our INO readers a weekly recap of the Futures market. He has been Senior Analyst for close to 15 years and has extensive knowledge of all of the commodity and option markets.

Michael frequently appears on multiple business networks including Bloomberg news, Fox Business, CNBC Worldwide, CNN Business, and Bloomberg TV. He is also a guest on First Business, which is a national and internationally syndicated business show.
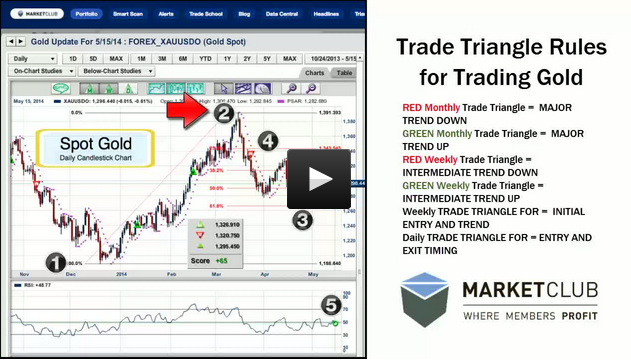
Gold Futures

Gold futures in the June contract are trading right at their 20 and 100 day moving average which doesn’t happen very often telling you that this market has basically been going sideways over the last 2 months with very little volatility is as prices seem to be bottoming out around the 1,270 – 1,280 at the current time I’m sitting on the sidelines in this market as there is no current trend but a breakout seems to becoming in my opinion as I do think with low interest rates remaining for quite some time that gold prices are currently bottoming out.

If you’re looking at buying this market at today’s price of 1,294 I would place your stop loss below the 4 week low 1,275 an ounce risking around $20 per contract or $2,000 if you’re looking at a bearish position I would sell at today’s price while placing my stop above the 10 day high which stands at 1,310 risking around $1,700 per contract as the gold chart has excellent chart structure allowing you to place tight stops. The story this week was a lot of money going into the U.S treasuries as investors think the U.S could be slipping into a recession and if that is true you would have to assume that gold prices will benefit from bad economic news so keep a close eye on this market.
TREND: SIDEWAYS
CHART STRUCTURE: OUTSTANDING

Continue reading "Weekly Futures Recap With Mike Seery"

Were The New Market Highs A Bull Trap?

On Tuesday we witnessed the S&P 500 and the DOW make new all-time highs. What is the significance of this? If you've been following my work and reading our comments then you're probably familiar with the 52-Week New Highs on Friday Rules which go like this:

Rule #1: On a new 52-week high, when the market closes at or close to its high on a Friday, buy and go home long for the weekend.

Rule #2: Exit the long position on the opening the following Tuesday.

Rule #3: If the market opens lower on Monday, exit this position immediately.

Since making their highs on Tuesday, the DOW and S&P 500 have been steadily moving lower and are in danger of closing lower for the week. Doing so would create a "negative engulfing line." A "negative engulfing line" or "bearish engulfing line," as it is some times called, is when the market price action engulfs the previous open and high period for the preceding week or day. If this turns out to be the case for the DOW and S&P 500 and this coming week they both close lower for the week, then the odds are pretty high that a top is more than likely in place. Continue reading "Were The New Market Highs A Bull Trap?"

Is Gold Getting Ready To Move To The Upside?

Today I would like to share with you some observations I have made in the Gold (FOREX:XAUUSDO) market. This market is looking more and more interesting right now. In this short 4 minute video, I point out some key technical characteristics that I believe will be driving gold in the future. I also give you a very important level in gold that, in my opinion, will skyrocket gold to new highs.

If you have a few minutes, you may enjoy learning how you can trade gold using MarketClub's Trade Triangles. In the past, the success rate of the Trade Triangles in the second quarter of the year was about 80%. With that in mind, I am watching Gold (FOREX:XAUUSDO) very closely.

Every success with MarketClub,
Adam Hewison
President, INO.com
Co-Creator, MarketClub

Fill In The Caption - Tim Geithner

What do you think would be the "perfect caption" for this photograph of the former 75th United States Secretary of the Treasury, Tim Geithner?

Here's my caption:
"I saved the world and paid no personal taxes. I am that smart!"

As always, I look forward to reading your captions.

For a good chuckle, be sure to read some of the captions from previous Fill In The Caption pictures.

Every Success,
Adam Hewison
President, INO.com
Co-Creator, MarketClub

What's Brewing In The Coffee Market?

One of the many things I enjoy about MarketClub is interacting with our members and discussing the markets. One of our members recently asked about the coffee market and what I thought about it.

"Would love to see your analysis of coffee as a special situation. Know it is currently in a pullback. Monthly is still green. Sounds like the shortage is expected to continue and increase. That should mean prices will go even higher. The question is where to get back in. I have been using the ETF JO to play it. Have had a good run with in and outs following TT's, RSI, and other. Expect we could all benefit from a right time buy and proper trailing stop and just following it for a while?"

As you can see, Harold is pretty smart investor and a valued member of MarketClub. He's also taken some nice profits out of the coffee market.

So without further ado, here are my thoughts on the July Coffee (NYMEX:KT.N14.E) market. Now remember, Harold is trading the ETF Ipath DJ-UBS Coffee Trust Sub-Index (PACF:JO). This ETF pretty much mimics what the coffee market is doing.

Chart Code
1. Trade Triangles
2. Price negative divergence
3. RSI negative divergence
4. Fibonacci support area

When trading in the futures markets, we are relying on the weekly Trade Triangle for the trend and the daily Trade Triangles for timing. It's also important not to forget the monthly Trade Triangle, as it shows the longer-term trend. Continue reading "What's Brewing In The Coffee Market?"