Are The Markets Just Teasing Us?

Hello traders everywhere! Adam Hewison here, President of INO.com and co-creator of MarketClub, with your video update for Wednesday, the 26th of March.

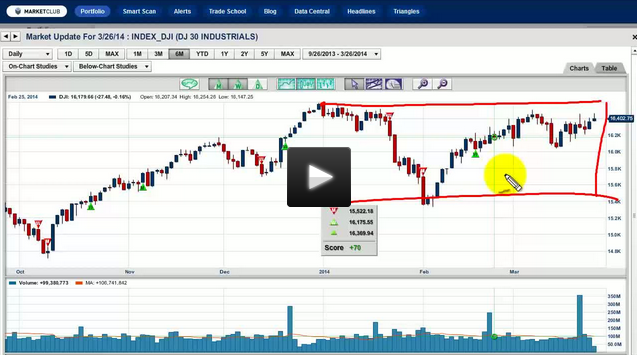
It would appear as though most of the major indices have just been spinning their wheels and going nowhere fast in the past 4 to 5 weeks as they have all been in a broad trading range. This type of market action can lull investors to complacency, but for me it has always been a wake-up call to pay close attention to the market as something big is going to happen.

As I see it, the market is doing one of two things, it's either building a base to move higher or it's a distribution top – only time will tell which is the correct answer.

One of our members suggested that the Dow 30 could be making an inverse head and shoulders formation. Certainly this is possible, but I need to see a clear breakout to the upside to confirm this formation.

The other concern I have is the damage done to the NASDAQ earlier this week as it fell to a 6-week low. How this particular index closes on Friday is going to be very important in my mind. Again, I will be watching this market very closely for signs of either a continuation of the bullish trend or a top. Continue reading "Are The Markets Just Teasing Us?"

Apple Is Trending Higher While Amazon Is Trending Lower, Why?

Yesterday, the Trade Triangle technology flashed two important signals for two major stocks.

Apple (NASDAQ:AAPL) triggered a new green weekly Trade Triangle, signaling that the upward trend was resuming. This signal pushed all of Apple’s Trade Triangles into the green column, indicating that higher prices could be ahead for this stock.

Amazon (NASDAQ:AMZN) triggered a new red weekly Trade Triangle, indicating prices should be going lower. This signal pushed all of Amazon’s Trade Triangles into the red column, suggesting downside pressure is ahead for this stock.

Apple (NASDAQ:AAPL) - Major Trend Bullish

New Green Weekly Trade Triangle on 3/24/14 at $539.66

Apple, who has enjoyed remarkable "rock star status" in the past, has really fallen into a sort of pedestrian-type mentality and doesn't seem to have the cachet that it once enjoyed. However, the chart formation that Apple is coming out of indicates the potential for another big move up to the $700 a share level. Perhaps this has to do with the potential partnership with Comcast or some new technology that we have yet to see.

I like the overall chart pattern on Apple and the continuation Trade Triangle breakout to the upside. I also like the fact that the major support, which was the previous high seen in September of last year, also represented a major Fibonacci support zone for this stock. My analysis on Apple would change should it move below the $520 level and major support at $500.

Amazon (NASDAQ:AMZN) - Major Trend Bearish

New Red Weekly Trade Triangle on 3/24/14 at $354.48

Continue reading "Apple Is Trending Higher While Amazon Is Trending Lower, Why?"

Obama Gives Putin A Billion Dollars!

A friend sent this to me over the weekend, I thought you might find the premise interesting.

Adam

------------

The Ukraine buys almost all its energy (natural gas) from Russia. Revenues from natural gas sales are a primary source of income for Russia.

Because of the recent disagreement between the Ukraine and Russia, Russia is raising the price of the natural gas it sells to the Ukraine.

The Ukraine is almost broke and can't afford the increase in the natural gas price because it would be forced into bankruptcy.

Obama just announced the United States is giving the Ukraine $1 billion to assist in paying for the higher priced natural gas it buys from Russia. Continue reading "Obama Gives Putin A Billion Dollars!"

Chart of The Week - Euro Futures

Each Week Longleaftrading.com will be providing us a chart of the week as analyzed by a member of their team. We hope that you enjoy and learn from this new feature.

This week’s focus turns to the June 2014 Euro currency futures, where recent weak March PMI results leads to a downward path of least resistance. The recent sell off has been supported by ongoing talk that the US might be closer to raising interest rates than previously thought, giving lift to the US Dollar.

We have seen a sharp retracement from the recent swing high of 139.66 posted on March 13, 2014. Last Wednesday and Thursday, we saw two sharp sell offs on increased volume, which would confirm a bearish sentiment for this week. Following the two day sell off, Friday saw a consolidation within Thursday’s range, and we open this week looking for a bearish continuation.

Continue reading "Chart of The Week - Euro Futures"

Weekly Futures Recap With Mike Seery

We’ve asked Michael Seery of SEERYFUTURES.COM to give our INO readers a weekly recap of the Futures market. He has been Senior Analyst for close to 15 years and has extensive knowledge of all of the commodity and option markets.

Michael frequently appears on multiple business networks including Bloomberg news, Fox Business, CNBC Worldwide, CNN Business, and Bloomberg TV. He is also a guest on First Business, which is a national and internationally syndicated business show.

10 Year Notes

The 10 year notes in Chicago this week sold off sharply due to the fact of Janet Yellen’s testimony stating that bond purchases that the Federal Reserve has been doing for several years now will come to an end in September with the possibility of rates rising 6 months after that date sending the yield on the 10 year note to 2.77% & in my opinion I think the bond market has started their bearish trend. Prices are trading below their 20 and 100 day moving average hitting an 8 week low and I’m recommending Continue reading "Weekly Futures Recap With Mike Seery"