
We've asked our friend Jim Robinson of profittrading.com to provide his expert analysis of charts to our readers. Each week he'll be analyzing a different chart using the Trade Triangles and his experience.
Today he is going to take a look at the technical picture of the S&P 500 Futures Contract (CME:SP.H14.E).
This week let's take a look at the S&P 500 futures contract.
When trading futures with the Trade Triangles you use the weekly Trade Triangles to tell trend and the daily Trade Triangles to time the entry and exits.
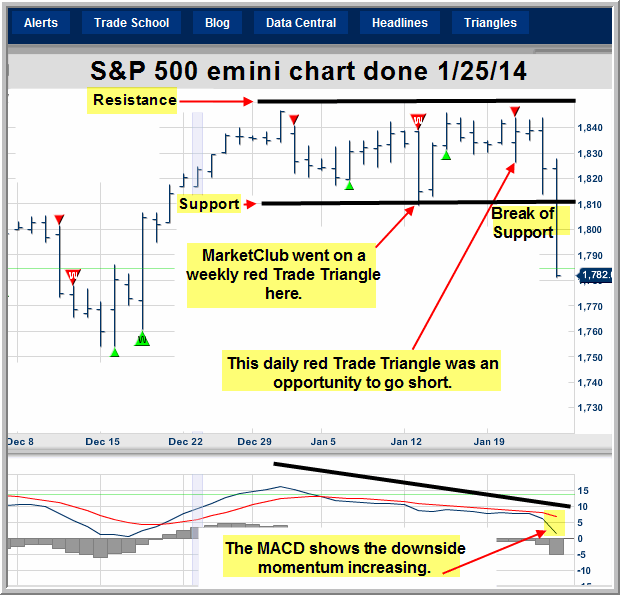
The weekly Trade Triangle turned red Trade on 1/13/14 and a red daily Trade Triangle on 1/21/14 which would have put any one trading the E-mini S&P 500 with the MarketClub system short just before Friday's 1/24/14 big down day and break of support. Continue reading "Chart to Watch - S&P 500 Futures"
 We’ve asked Michael Seery of