Dollar Takes A Plunge; Where Will It Land?

Lior Alkalay - INO.com Contributor - Forex


Undoubtedly, this February will be remembered as painful for the dollar. Investors have long awaited the opportunity to short the greenback after a prolonged period of steep gains. When US growth came out surprisingly weak, FX traders pounced, taking the dollar on a brutal roller coaster ride.

Then we had Janet Yellen’s testimony, which suggested banks should be prepared for negative interest rates. Many considered that a hit below the belt as investors were betting on more rate hikes. So now, they’ve got to get ready for negative interest rates? No one was prepared for that remark, despite Yellen’s suggestion that it was only a remote possibility. Of course, now, the million dollar question is, how low can the dollar go?

Short Term Dollar Outlook

As with all corrections, the first catalyst is always about momentum. The question of whether that will lead to a wider correction is fundamental. But what about the imminent target? That’s driven by technical momentum. So what do the technicals say?

Daily Chart of the U.S. Dollar Index
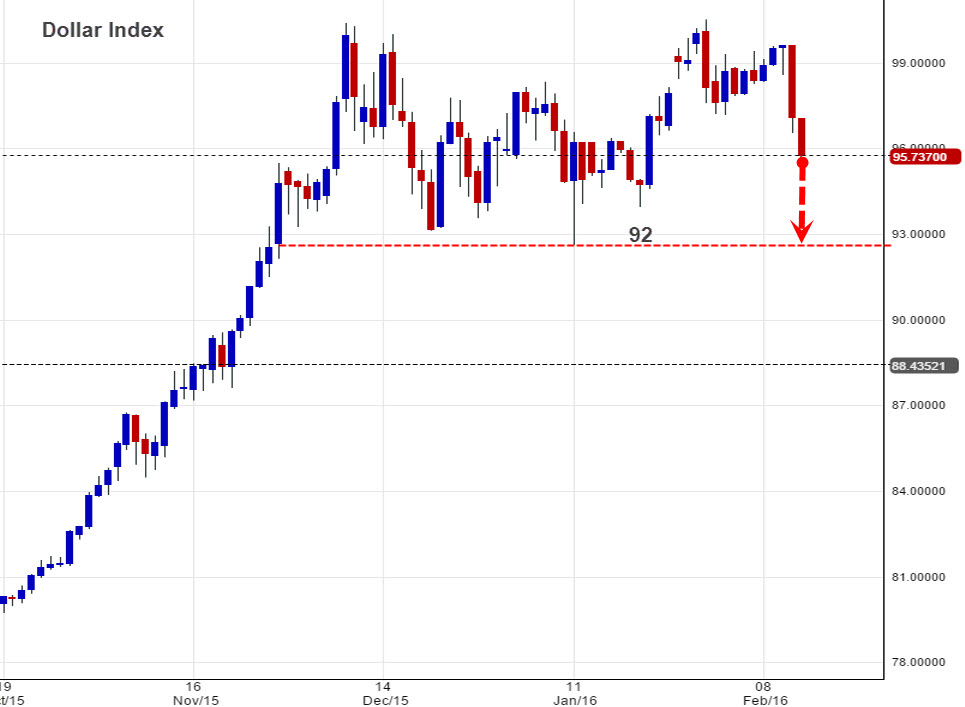
Chart courtesy of Netdania.com

As seen in the Dollar index chart above there are two key levels in this correction. The first is our resistance level at 100. The Dollar index has been attempting to break this level for a while now, though without success. When the Dollar index failed, it was really only a matter of time before the correction would come. And so as it did. Continue reading "Dollar Takes A Plunge; Where Will It Land?"

Valentine's Day - Sending Love + Water To Flint


What a great time of year to dish out some more INO love!

Clean, potable water has always been a global issue, but rarely is it something we hear about in our own backyard. The folks of Flint, Michigan have been dealing with toxic water since a source switch in 2014. Being able to purchase potable water is not an easy task for some. To help with a temporary solution to this major problem, organizations have been established to collect water donations and transport them to Flint for distribution.

Maryland resident and Flint, Michigan native, Ron Lee, wanted to help his hometown. Ron teamed up with "Well of Hope" to help collect, transport and distribute water donations. He and his family drove a giant moving truck filled with water all the way to Flint early Saturday morning. They will hand-deliver this much-needed​ resource to this area in great need.

We managed to get our water donation on the truck right before they left! Ron was grateful and assured us that our gift of love will be given directly to many Flint residents who are in dire need.

Learn more about Well of Hope and their ongoing efforts to help the citizens of Flint, Michigan.

Best,
Lindsay Bittinger
INO.com, Inc.

Can The Fed Drop Interest Rates Below 0%?

By: Elliott Wave International

This question is not as preposterous as it may seem.

For the financial markets, the biggest event of the week starts tomorrow: On Wednesday and Thursday (Feb. 10-11) Fed chair Janet Yellen will appear before Congress to deliver her semi-annual Monetary Policy Report.

"It's huge." That's how one strategist put it this morning, in a CNBC interview about the importance of Yellen's testimony.

Why are all eyes on Yellen? Maybe because by now, almost everyone has forgotten how powerless the Fed appeared in 2007-2009, when none of its measures could stop the financial crisis. Despite the recent market chaos, six years of rising stock prices reaffirmed the notion that the Fed can move mountains. "As the Fed goes, so do the markets" is the current mantra -- so, on Wednesday and Thursday, analysts will be listening carefully: Will Yellen mention the ongoing market turmoil? Continue reading "Can The Fed Drop Interest Rates Below 0%?"

Weekly Futures Recap With Mike Seery

We've asked Michael Seery of SEERYFUTURES.COM to give our INO readers a weekly recap of the Futures market. He has been Senior Analyst for close to 15 years and has extensive knowledge of all of the commodity and option markets.

Michael frequently appears on multiple business networks including Bloomberg news, Fox Business, CNBC Worldwide, CNN Business, and Bloomberg TV. He is also a guest on First Business, which is a national and internationally syndicated business show.

Crude Oil Futures

Crude oil futures in the March contract are trading below their 20 and 100-day moving average hitting a contract and multi-year low in Thursday’s trade before rallying this Friday currently trading at 28.10 a barrel up nearly $2 on massive short covering ending the week. Crude oil futures traded as low as 26.05 in Thursday’s trade only to rally, but this market certainly remains weak, but at the current time on sitting on the sidelines as the risk does not meet my criteria as the chart structure is very poor presently. As a trader you must think about probabilities of success and at the current time I’m only focused on the soft commodities as they have very tight chart structure with solid trends to the downside as crude oil remains choppy down these levels as the easy money to the downside has already been made in my opinion. Continue reading "Weekly Futures Recap With Mike Seery"

This Indicator Is A Winner For Long-Term Traders

It has been one heck of a week to say the very least and it is not over yet. I want to take a look at a tool that I'm pretty confident in saying that very few traders ever watch. The tool I'm discussing is MarketClub's quarterly charts. If you have not seen this MarketClub feature, you may want to check it out, particularly if you are a long-term trader.

I'm going to be looking at the S&P 500 to see just how close the quarterly chart is to turning negative. I'm also going to be looking at a textbook example of a downside measurement on the S&P 500.

I will also be analyzing Apple and Yahoo, both of which could be in for a pretty bumpy ride.

Let's begin by looking at the S&P 500 (CME:SP500) and the textbook example I mentioned earlier for measuring a down move. I'm using a close-only weekly chart and you will see exactly how I measure the move.

Weekly Chart of S&P 500 (CME:SP500)

Next let's take a look at this long-term quarterly chart of the S&P 500 and as you can see it is poised to possibly break the positive long-term trend that has been in place since October of 2010. Continue reading "This Indicator Is A Winner For Long-Term Traders"