The following is an excerpt from the eBook, Options Trading 101, authored by MarketClub Options lead trainer, Trader Travis. Learn more about MarketClub Options and how to obtain this entire eBook.
---
 Learning how to read an option chain is a vital component to options trading. Many traders lose money because they don't fully understand option chains.
An option chain is essentially a list of all the stock option contracts available for a given security (stock).
There are only two types of stock option contracts, puts and calls, so an option chain is essentially a list of all the puts and calls available for the particular stock you're looking at.
Now that wasn't so hard to understand, was it? Well the confusing part comes when you actually pull up a stock option chain.
All that easy-to-understand information suddenly gets lost in translation and you're left looking at a table full of numbers and symbols that make absolutely no sense at all.
Part of the confusion in understanding option chains is that every option chain looks different.
If you go to Yahoo, MSN, CBOE, or your brokerage account and pull up an option quote, you will notice that the layout of each of their option chains is completely different.
However, they all essentially have the same information displayed, but look completely different.

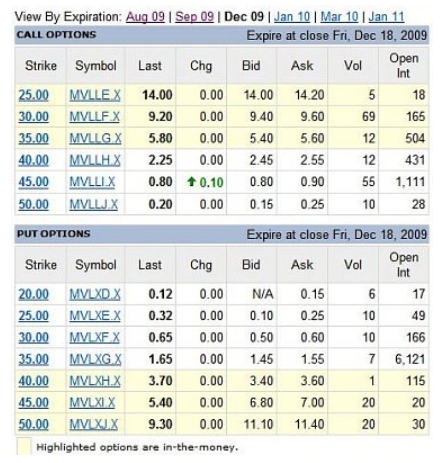
Let's use a snippet of the stock option chain listed above, which is a stock option chain of the stock symbol “MV":
Expiration Month
As you can see from the picture, there are several different expiration months listed horizontally across the top of the option chain (Aug 09, Sep 09, Dec 09, etc.). For our example we are looking at all the call and put options that expire the 3rd week of December 2009.
Some traders want to stay in a trade 1 week, some want to stay in a trade 2 months, so your trading plan will dictate which month you look at.
Call Options & Put Options
Each stock option chain will list out all the call options and all the put options for the particular stock. Depending on which option chain you are looking at, the call options may be listed above the put options or sometimes the calls and puts are listed side-by-side.
Strike
The first column lists all of the different strike prices of the stock that you can trade. The strike/exercise price of an option is the "price" at which the stock will be bought or sold when the option is exercised.
Symbol
The second column lists all of the different ticker/trading symbols for each stock option. "MVLLE.X" is the ticker symbol for the 09 December 25 call option. The symbol identifies 4 things: which stock this option belongs to, what the strike price is, what month it expires in, and if it is a call or a put option.
Last
The third column lists the last price at which an option was traded (was opened or closed). It's the price at which the transaction took place.
WARNING: This transaction could have been minutes, days, or weeks ago, and may not reflect the current market price.
Change (Chg)
The fourth column lists the change in the options price. It shows how much the option price has risen or fallen since the previous day's close.
Bid
The Bid price is the price that a buyer is willing to pay for that particular stock option. It's like buying a home at an auction, you bid (offer) what you are willing to pay for the home.
Ask
The Ask price is the price that a seller is willing to accept for that particular stock option (this is the price the seller is "asking" for).
WARNING: One stock option contract represents or controls 100 shares of stock. So
whatever Bid/Ask price you see has to be multiplied by 100. This will be the actual cost of the contract.
Volume (Vol)
List how many stock option contracts were traded throughout the day.
Open Interest (Open Int)
This column lists the total number of option contracts still outstanding. These are contracts that have not been exercised, closed, or expired. The higher the open interests, the easier it will be to buy or sell the stock option because it means a greater deal of traders are trading this stock option.
Keep an eye out for my next post.
Best,

---
MarketClub has been helping thousands of traders successfully navigate the markets for the last decade. But now, with MarketClub Options, members can learn how to accelerate their profits with the power of leverage and a strategy built for long-term success. Trader Travis will show you step-by-step how to find, execute and manage winning options trades. Watch his 10 Minute MarketClub Options Strategy.