Yesterday, the Trade Triangle technology flashed two important signals for two major stocks.
Apple (NASDAQ:AAPL) triggered a new green weekly Trade Triangle, signaling that the upward trend was resuming. This signal pushed all of Apple’s Trade Triangles into the green column, indicating that higher prices could be ahead for this stock.
Amazon (NASDAQ:AMZN) triggered a new red weekly Trade Triangle, indicating prices should be going lower. This signal pushed all of Amazon’s Trade Triangles into the red column, suggesting downside pressure is ahead for this stock.
Apple (NASDAQ:AAPL) - Major Trend Bullish
New Green Weekly Trade Triangle on 3/24/14 at $539.66
Apple, who has enjoyed remarkable "rock star status" in the past, has really fallen into a sort of pedestrian-type mentality and doesn't seem to have the cachet that it once enjoyed. However, the chart formation that Apple is coming out of indicates the potential for another big move up to the $700 a share level. Perhaps this has to do with the potential partnership with Comcast or some new technology that we have yet to see.
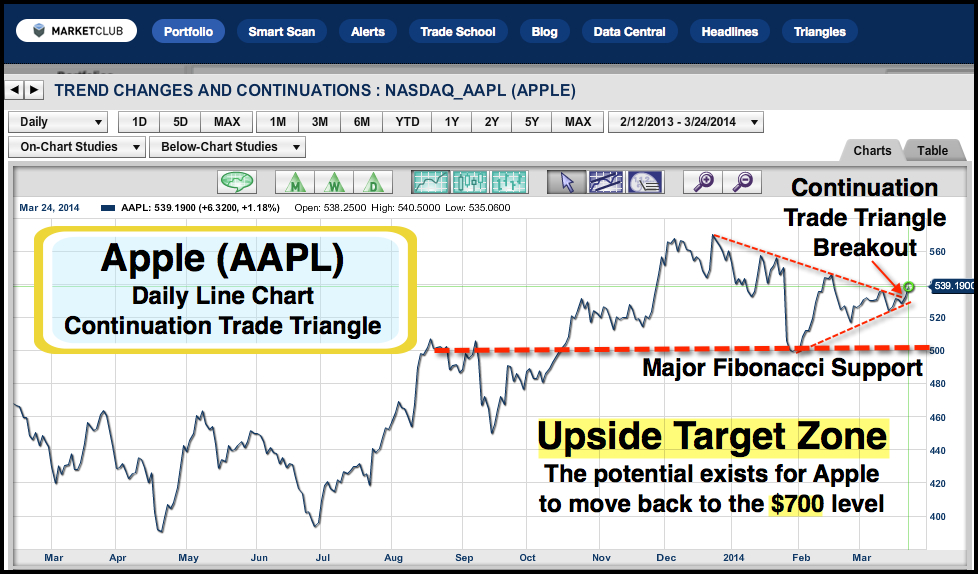
I like the overall chart pattern on Apple and the continuation Trade Triangle breakout to the upside. I also like the fact that the major support, which was the previous high seen in September of last year, also represented a major Fibonacci support zone for this stock. My analysis on Apple would change should it move below the $520 level and major support at $500.
Amazon (NASDAQ:AMZN) - Major Trend Bearish
New Red Weekly Trade Triangle on 3/24/14 at $354.48
Continue reading "Apple Is Trending Higher While Amazon Is Trending Lower, Why?" →


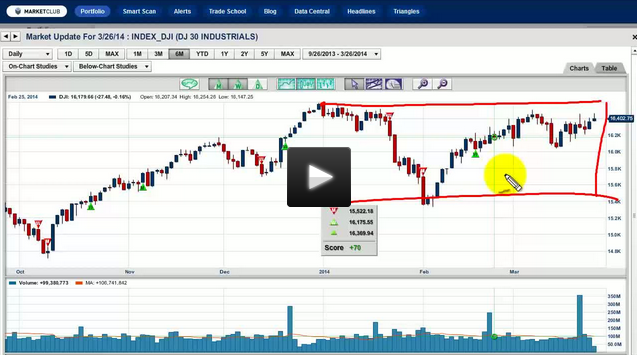
 Hello traders everywhere! Adam Hewison here, President of INO.com and co-creator of MarketClub, with your