Copper Update: This Is How I Would Trade This Sell Setup

Two weeks ago I put the spotlight on copper as I found there was a nice trading opportunity in the making. The trigger for the short trade was set at the $2.75 (below minor low) to avoid emotional trading or simple guessing, and it paid well as the price dipped from the $2.84 area and stopped 2/10 of the cent above the preset trigger. Then the price reversed much higher as I expected as it should retest the former top of $2.87 before it finally goes down.

We call it a trade setup. Before that, we had an idea, which was based on some kind of analysis. So, converting good ideas into profitable trades makes us better traders. Add patience, discipline and some sort of trading strategy to get consistent profits. Otherwise, a good idea could remain to be just a good idea without pleasant outcomes for us.

Let me show you in this post how I would trade this copper idea on the short side step by step.

Step 1. Chart Analysis: Copper Futures Daily,

Copper
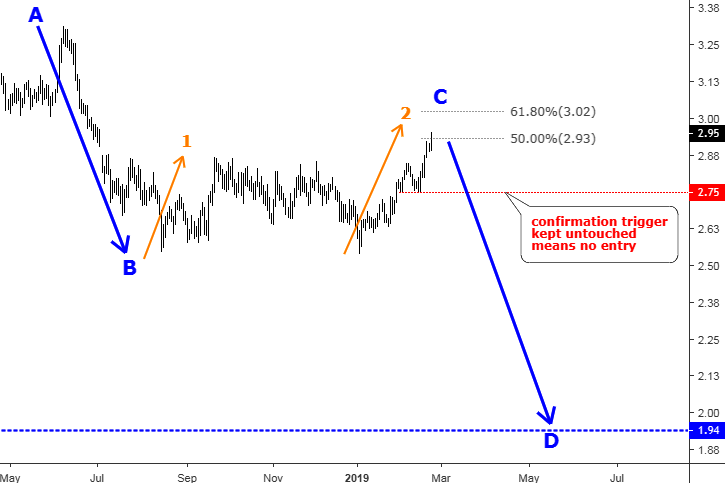
Chart courtesy of tradingview.com
Continue reading "Copper Update: This Is How I Would Trade This Sell Setup"

Our May Stock Market Prediction - Part 2

If you missed PART 1 (SP500 Price Forecast) be sure to read it here.

Here is PART II let’s take a look at the NQ Weekly chart with the ADL predictive price modeling.

We are going to include predictions made by our Adaptive Dynamic Learning (ADL) price modeling system that originated from December 2017 going all the way forward through to the end of May 2019.

At this point, we are going to highlight our earlier predictions (all of 2018 and into Q1/Q2 of 2019) and show you what the market has done since these calls were made back in September 2018. Pay attention to this weekly chart and pay attention to the YELLOW ARROWS on this chart. We have highlighted key predictive price modeling points with these yellow arrows on the chart to show you what our ADL predictive modeling system suggested would happen back in December 2017.

Now, take a look at the NQ Weekly chart with the ADL predictive price modeling results displayed onto it. Pay attention to the similarities in the price patterns and the rotational modeling differences between the two charts. The ES ADL modeling predictions from “Part I” are similar to this NQ chart, but the differences really tell us about how the technology-heavy NASDAQ (NQ) will react in a different manner than the Blue-Chip heavy ES. Continue reading "Our May Stock Market Prediction - Part 2"

Our May Stock Market Prediction - Part 1

As we enter the final stage of our stock market prediction from nearly 5 months ago, we thought it would be a good time to revisit these predictions and to update all of our followers with some timely and, apparently, accurate market data. We hope that many of you remember out predictions from September 2018 where we called for a 5~8% market decline, followed by a basing market headed into the November 2018 US elections, followed by a deep “Ultimate Low” price rotation before we called for an incredible upside price rally? The reason it is so important to watch for and understand all of our research is that we are attempting to provide great value and insight to our followers as well as help them protect their open positions from unknown risks.

As a bonus to all of this, we are going to include predictions made by our Adaptive Dynamic Learning (ADL) price modeling system that originated from December 2017 going all the way forward through to the end of May 2019. Can you imagine what it would be like to have a tool that could show you what is likely to happen going forward 6 months, 12 months or even 24 months into the future? Well, that is what we have with the ADL predictive price modeling system and we are going to show you how well it has been able to pick the future of the markets for the past 15+ months. Here we go.

At this point, we are going to highlight our earlier predictions (all of 2018 and into Q1/Q2 of 2019) and show you what the market has done since these calls were made back in September 2018. Pay attention to this Weekly ES (S&P 500 chart) and pay attention to the YELLOW ARROWS on this chart. We have highlighted key predictive price modeling points with these yellow arrows on the chart to show you what our ADL predictive modeling system suggested would happen back in December 2017. Continue reading "Our May Stock Market Prediction - Part 1"

Copper Gives Bears Another Chance

Last July I posted a monthly chart of copper futures to show you that the earlier move up had been completed when the price hit the accurately predicted $3.32 level and we have entered a bearish mode.

The big short game was set between the $3.32 and $1.94 extremes. The earlier post was calling for the price of copper to retest the former valley of $1.94. Below are the poll results with your expectations recorded in July of 2018. Again, I am very thankful for your stable activity!

Copper

The majority of you agreed with my opinion that the copper could revisit the former low of $1.94. 2018 finished at the $2.64 mark, which is far away from the target and below I will show you why and what could be the next for copper. Continue reading "Copper Gives Bears Another Chance"

How Far Could Crude Oil Go?

The price of crude oil closed above the earlier top of $54.6 last Friday to confirm the reversal to the upside. So, is it the right time to find out how far we can go with it?

At the end of last May, I posted an early warning of the imminent crash of crude oil price amid the mass media euphoria from the dream of the $100 price tag per barrel, which was a good contrarian indicator. The price of WTI finally dropped last October after it broke long-term support.

I am very grateful to you as you were very active on the poll where I asked you to share your expectations about the crude oil price by the end of 2018. Below are the results of it.

wti crude oil futures

As we can see most of you were ready for the drop of the oil price in the next lower range between $50 and $70 marks, although there were oil optimists in second place, who bet on the price to be in the $70-$90 range. Only those whose bets ranked the third ($30-$50) turned out to be right as oil finished the previous year at $45.8 after hitting the $42 area the day before Christmas.

In this post, I would like to show you some historical similarities, which could help us to understand how deeply the current pullback could go. Let’s start with the bigger chart. Continue reading "How Far Could Crude Oil Go?"