Palladium Update: Contradiction

In October 2021, I shared with you my technical outlook for palladium futures.

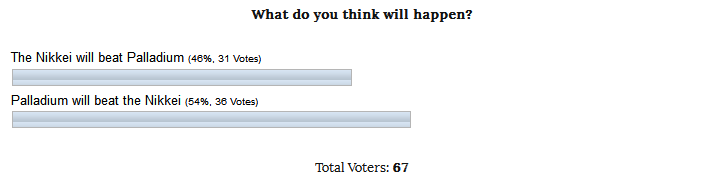
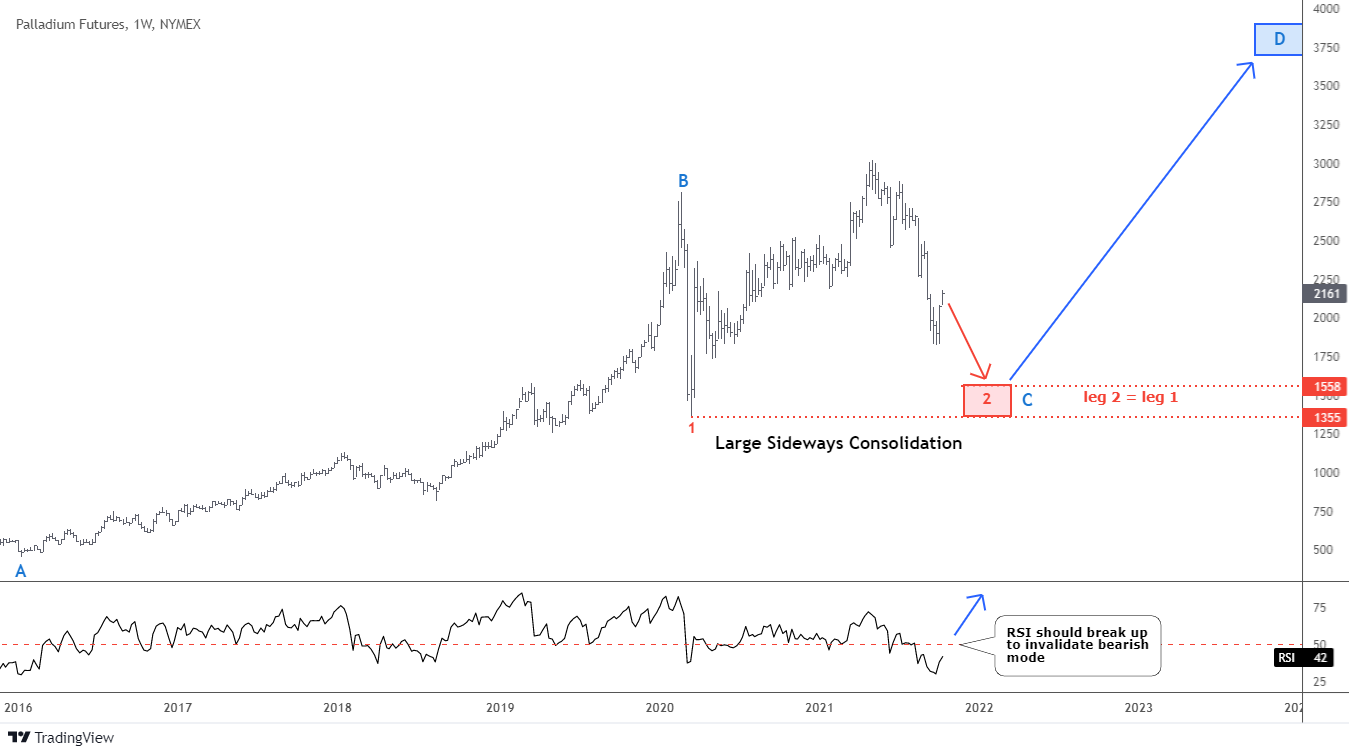
The chart structure was clear; therefore, I was confident of further collapse of palladium price. The results of your ballot are in the graph below.

Palladium

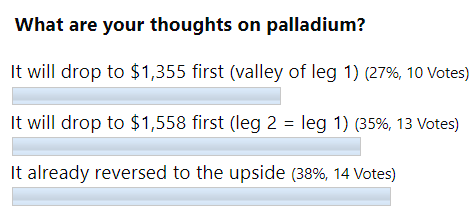
Most of you voted for a bullish trend to resume. The second popular bet turned out to be the most accurate as the price has pierced the upper side of the preset bearish target area at $1,558.

The next step after two-leg consolidation was going to be a huge growth of the metal’s price. However, the industry fundamentals do not support that bold plan. Continue reading "Palladium Update: Contradiction"

Precious Metals In 2016: The Dark Horse Won The Prize

Aibek Burabayev - INO.com Contributor - Metals


This interesting year is coming to an end and in this post I would like to offer you a summary of precious metals’ dynamics in 2016.

Chart 1. Metals in 2016: Boom And Bust

Precious Metals 2016
Chart courtesy of tradingview.com

This year metal trading was quite exciting. The chart shows that we have gone through a full Boom and Bust cycle and the top of the cycle amazingly coincides with the middle of a year, when metals showed a maximum gain (except Palladium) within the 25-50% range. Ideal distribution within a single year! Continue reading "Precious Metals In 2016: The Dark Horse Won The Prize"

Pendulum Experiment Result: Success! One More?

Aibek Burabayev - INO.com Contributor - Metals


Here we are! The experiment came to its final stage - the summary. Almost eight months ago we put two completely different instruments on the starting line in an exciting competition, which should have proved or refuted the assumption of the ‘pendulum effect’. The Japanese Nikkei index was a top performing instrument in November 2015 with +13% gains while Palladium was the top losing metal with -24% losses.

Chart 1. Voting results November 2015: The Majority Bet On The Success Of The Experiment!

Chart 1. INO.com Voting results November 2015

Above is the screenshot of the ballot results for the experiment. Most of you bet on Palladium winning, which means the success of the experiment, and you were absolutely right dear readers!!! Congratulations! And thank you for the support of the experiment! See the chart below for the confirmation. Continue reading "Pendulum Experiment Result: Success! One More?"

Pendulum Experiment Snapshot: Promising Progress

Aibek Burabayev - INO.com Contributor - Metals


Last November I brought an experiment to your attention based purely on the laws of physics. I called it the "Pendulum experiment." The idea of it was to pick the strongest and the weakest asset by performance in 2015 and to check if they will move back like a pendulum and exchange their performance position relative to each other – the weakest will become stronger, the strongest will become weaker.

Just to refresh your memory: the Nikkei index was the top performer and Palladium was the weakest metal (YTD November 2015). I want to express my gratitude for the active participation in voting; the results are in the graph below.

Chart 1. Nikkei vs. Palladium Voting Results:

Poll Results INO.com
Poll results courtesy of INO.com

The odds were in favor of Palladium with a margin of 5 votes (8%). It was almost a split even bet and we have another couple of months to see the final results. Now let us check the current progress of the assets as we passed the halftime period. Continue reading "Pendulum Experiment Snapshot: Promising Progress"

Pendulum Experiment: The Weakest Metal Vs. The Strongest Future

Aibek Burabayev - INO.com Contributor - Metals


Dear readers, I hope things are good if you are short both top precious metals as per my Gold and Silver updates and you are enjoying the rising gains. As nothing unforeseen has been happening, let us do an experiment.

Do you know what a pendulum is and what the effect it has on an instrument? When something moves one way and then swings back and we push it harder forward, it will move back deeper for the distance that is equal to the distance between equilibrium and the forward point. Swings and waves are a normal part of our everyday life, and that is true for the markets as well. Continue reading "Pendulum Experiment: The Weakest Metal Vs. The Strongest Future"