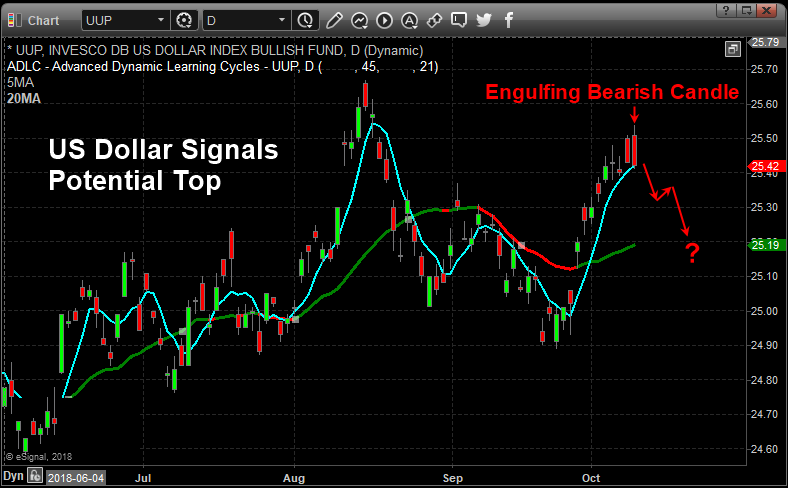
A unique setup has occurred in the Invesco DB US Dollar Index (UUP) that resembles an Engulfing Bearish type of pattern (even though it is not technically an Engulfing Bearish pattern). Technically, an Engulfing Bearish pattern should consist of a green candle followed by a larger red candle whereas the red candle’s body (the open to close range) completely engulfs the previous candle’s body. In the instance, we are highlighting in this article, a unique variation of what we’ll call a “Completely Filled Engulfing Bearish” pattern is setting up.
This is when two red candles set up in an Engulfing Bearish type of formation – omitting the requirement that the first candle is green. Japanese Candlesticks help us to identify the psychology of the market price in relation to our other specialized tools. We believe this formation is important because both of the red candlesticks that make up this pattern opened much higher than the previous bar’s close and dramatically sold off into the close of each session. We believe this type of rotation clearly illustrated that price is reaching resistance near $25.50 and pushing lower because of this strong resistance. We also believe this resistance/pattern will set up a downside price move in the US Dollar very soon.
Below, we have highlighted the traditional formation of an Engulfing Bearish Candlestick pattern. The example chart, to the right of this definition, shows another variation of the Engulfing Bearish pattern setting up after three minor sideways candles. The interpretation of this Bearish Reversal pattern is subjective in terms of understanding the psychological representation of the Engulfing Bearish pattern. This pattern represents a total reversal of power within the price bar where the buyers were in control at the open (resulting in a higher opening price) and lost control through the trading session to allow the sellers to drive the price much lower into the close of the trading session. Thus, the Engulfing Bearish pattern represents a “key pivot point” in price that may prompt a larger downside move in the near future. Continue reading "Bearish Pattern Warns Of Dollar Weakness"


 Today's Guest Blog post comes courtesy of Kathleen Brooks who is a UK and EMEA research director at Forex.com based in London. She uses both fundamental and technical methods in her analysis. She provides daily research and market updates as well as a weekly webinar on market themes. She is a regular contributor to Yahoo Finance, Reuters Great Debate Blog as well as a host of other international publications. She is often quoted in the global financial press and is a regular contributor on business TV including CNBC, CNBC Arabia, the BBC and Bloomberg. She started her career in finance at BP where she worked first as a business analyst in its trading division and then as a trading analyst in its foreign exchange dealing room.