

In my previous Gold & Silver post published earlier this month, I promised to update a long-term chart of Gold as I observed some interesting price behavior in a related instrument. But before I do that, let me speak about the Fed’s decision last Wednesday and that “related to gold” instrument first.
The positive dynamics of the US economy underpinned the Fed’s decision to finally start to trim its huge balance sheet next month, besides that there is a big chance of another rate hike this December. It wasn’t a shock to the market, and some big players already started their game weeks before the Fed moved from rhetoric to action.
The Fed’s decision could have a double impact on US interest rates as falling US Treasury notes increase the yields, and the impending rate hike could secure that situation. I was writing about the high possibility of this almost a month ago and last Wednesday we received a first-hand confirmation from the Fed.
Chart 1. 10-Year U.S. Treasury Notes Futures Monthly: Bear Flag
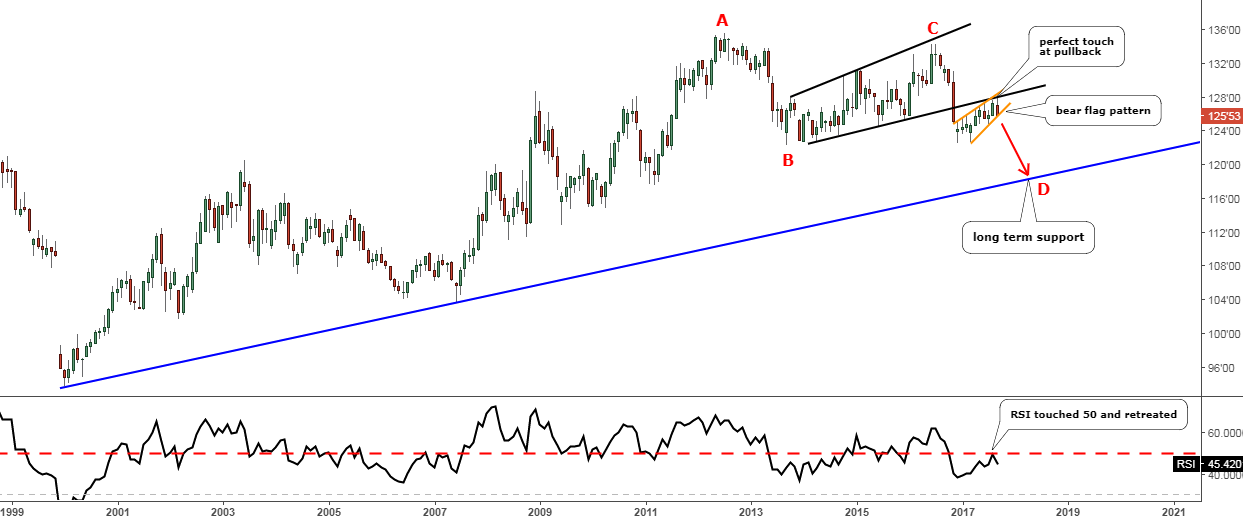
Chart courtesy of tradingview.com
Last month when I wrote the earlier post the price of 10-year U.S. Treasury Notes Futures (UST) was at the $126'49 mark. The neckline of a giant Head & Shoulders pattern was broken, and the price shaped a pullback to the breached support. I called for more strength to come for the price to reach out higher to the neckline mentioned above before another drop would start.
Indeed, UST perfectly touched the previous support as you can see in the chart above to hit the $127'57 high mark at the beginning of this month and that was it. Weeks before the Fed meeting the price reversed and dropped quickly into the $125 area. The RSI confirmed that action and is touching the resistance at the 50 level as did the price and then retreated.
Globally, the UST started to fall from July 2012, and I labeled that point as A of the AB segment. Then there was a massive consolidation contoured with the black lines. It peaked at the $134'14 mark (C point) and then the current drop started. Inside the current CD segment, there is another small consolidation (orange lines), which shaped a Bear Flag pattern (one of my favorites). The price already started to test the support of the pattern, and we got a breach on the daily charts. The drop could hit the blue long-term support line at the $118 level. At that level, the ratio between CD and AB segment could reach the 1.272 Fibonacci number.
This drop could take time till the 2Q 2018 (depends on the angle of the drop) when the Fed would accelerate the balance trim (+$10 billion per month to every new quarter). What could go wrong at that time to let the blue support reverse the price to the upside? There are at least two options – the first is Janet Yellen’s job, which is up for renewal next February or an adverse reaction to the US economy to the Fed’s tightening.
Chart 2. Gold Monthly: Downside Scenario
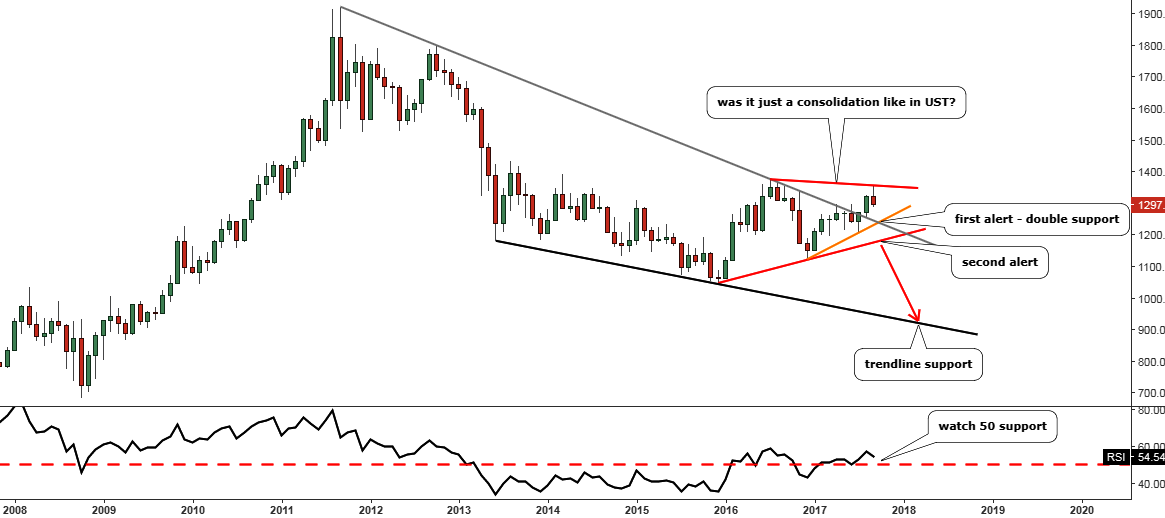
Chart courtesy of tradingview.com
Gold and UST are the haven instruments, and they have a powerful correlation as it was shown on the chart last month. Let’s look at the gold through the prism of the above-described perspective of falling UST.
The future price action in the UST is more or less predetermined by the Fed’s decision, but what about gold? The metal already has the first sign of the similar move to UST – the current monthly candle is bearish (red). However, the RSI is slightly, but above the significant 50 level of support. Besides that, the price is above the broken monthly resistance line (gray). Overall, the picture doesn’t look as bad as in UST yet.
I highlighted the important triggers on the chart. The first alert will be when the price of the metal returns below the former resistance (gray). It is a double support as the orange trendline intersects that level too at the $1240. I think the RSI would dip below 50 then confirming that move. The second support is currently located at the $1175 mark (red support). The December 2016 low could offer the next level of support at the $1122 mark.
The black support could finally catch the price at the $900 level, but it could take some time to reach there. This area has provided tremendous volatility in the past between the $680 and $1035 marks. If you look carefully at the chart you will see the familiar shape which is contoured with gray and black lines, this pattern is called a Falling Wedge, and it’s a reversal pattern.
So, if this downside scenario plays out, then it could be the last drop within a massive correction on the monthly chart. This situation coincides with the possible upside rejection from the long-term blue support in the UST chart above. Let’s live and see if the correlation hits gold as the future is hidden from us and we could only read the clues.
Intelligent trades!
Aibek Burabayev
INO.com Contributor, Metals
Disclosure: This contributor has no positions in any stocks mentioned in this article. This article is the opinion of the contributor themselves. The above is a matter of opinion provided for general information purposes only and is not intended as investment advice. This contributor is not receiving compensation (other than from INO.com) for their opinion.