

What goes up should come down. The precious metals are in a good bullish move, but one should be prepared for the possible downside corrections ahead as the natural phases of market cycles change again and again.
Chart 1. Gold Daily: Channel’s Top Hurdle
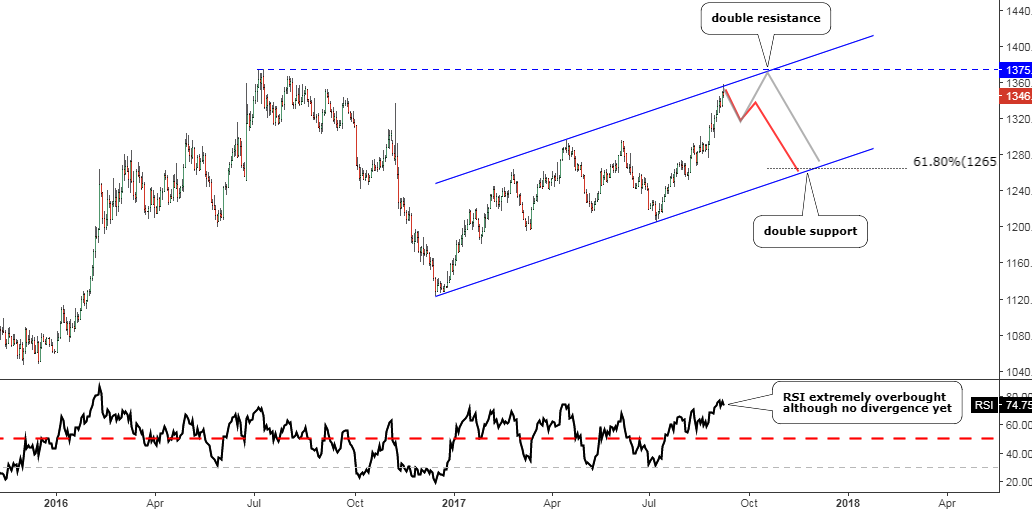
Chart courtesy of tradingview.com
When it comes to money, people start to excel in math, even if they didn’t in school. And so did I when it came to the market analysis, I started to understand both the beauty and power of geometry in the trends even though I didn’t like this subject in the school.
The price of gold made a tiny puncture on the upper side of the blue ascending channel but then retraced to close below it It’s another illustration of how powerful the trend channels can be. However, even if it gets broken, again, it will add more value as evidence of an even stronger price move.
There's almost $17 left for gold to hit the previous major top, but it vanished behind the channel’s top as does a setting sun behind the mountains. What’s next? It’s the perpetual question in the markets.
I have added two main paths to the chart above. The red zigzag shows that the market could start to drop to the downside of the blue channel where additional 61.8% Fibonacci support is located at the $1265 mark. The gray polyline shows that we could see a temporary weakness getting rid of weak (cautious) hands and attract the last buyers to the upside to finally hit the previous major top at $1375 and retest the upside of the channel once again. Only after that, it could fall into a correction.
The RSI shows the extremely overbought condition, but there is no bearish divergence yet as it's just peaked. That tells us about the equal possibility of both paths.
Chart 2. Silver Daily: The Middle Of The Channel Keeps The Price Beneath The Breakout
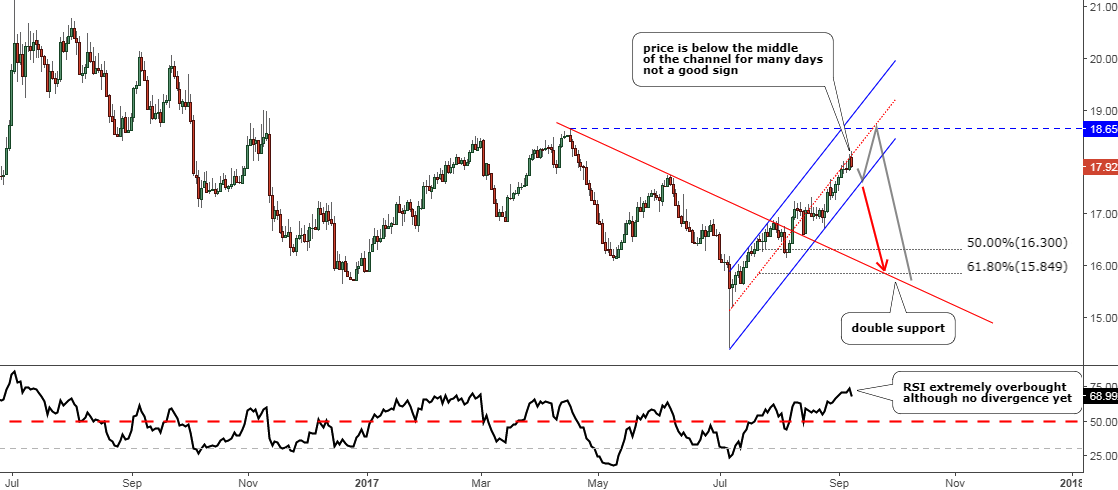
Chart courtesy of tradingview.com
Silver has restored all of its losses that occurred during The Flash Crash and has even broken above the previous top at the $17.75 mark. The blue uptrend channel stays inside the bullish zigzag of the price. The orange dotted line of the middle of this channel divides it into two smaller channels.
The position of the price inside of the channel could tell us a lot about the current power status of the trend. As we can see from the start, the move was robust, and the price took its place on the upper side of the channel. Then the August consolidation brought the price on the lower side below the orange dotted line. In spite of the further strong move to the upside, the price is still there below the middle. The answer is simple, the stronger the trend, the sharper the angle and the higher the position of the price in the trend. The consolidation phases consume time and change the whole angle of the trend to make it softer. Only a very strong market move could bring the price back above that “waterline.”
The red down arrow below the channel shows the path of the drop once the channel gets broken. It could reach double support at the $15.85 mark there where both the previously broken red trendline and the 61.8% Fibonacci retracement level intersect. The gray zig-zag implies a temporary weakness followed by a final move to the upside to hit the $18.65 level. After that, we could see a consolidation of weakness in the metal.
During the entire price move, the Risk/Reward ratio fluctuates, and the closer to the target the higher is the risk as any reverse would start to erase any accumulated paper gains. In this situation, you should decide where the gain decrease would be intolerable to jump out of the trade. Of course, it all matters only to short term traders who follow these updates.
I observe an interesting price development in a related instrument, and I will update the long-term chart for gold in the coming posts.
Intelligent trades!
Aibek Burabayev
INO.com Contributor, Metals
Disclosure: This contributor has no positions in any stocks mentioned in this article. This article is the opinion of the contributor themselves. The above is a matter of opinion provided for general information purposes only and is not intended as investment advice. This contributor is not receiving compensation (other than from INO.com) for their opinion.