Silver Is A Game Changer

Last month I shared with you “Three Options To Go” for silver price, namely “Optimistic”, “Pessimistic” and the sideways option called “Extended consolidation” on one chart. Below are your bets for each option.

Silver

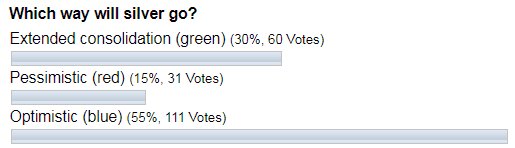
Most of you chose the “Optimistic” option where silver should continue to the upside after completing the correction. It’s a rare case when the minority was right as the “Pessimistic” scenario played out the next week after the post. The metal’s price dropped into the abyss at $11.64, reaching the 11-year low in the price area of distant January 2009. I think this move surprised not only me, although I said that it could reach $11 area, but even those who clicked the right answer as it was so quick as price sank within a few weeks from $16.66 for 30%!!!

Silver just can’t stop surprising us as it suddenly changes from latency mode to explosion mode and back, again and again.

The interesting thing happened next Continue reading "Silver Is A Game Changer"

Gold Extends Consolidation Giving Silver Another Chance

Gold and silver exchange leading roles in the market quite often, especially on the short-term charts. Last time I wrote about it silver saved gold from collapse at the start of this month. The white metal unexpectedly bounced off the earlier low reversing the drop of the yellow metal.

This time gold took the lead as its failure to break below the Bear Flag let silver lick its wounds and return above the $14 handle.

Both metals are still trapped in the middle of the range set by the earlier heavy drop, which first occurred in gold and then it was repeated in the silver market. In this post, I have focused on the local structure as the bigger picture remains unchanged.

Chart 1. Gold Daily: 3rd Leg Up Is Uncommon But Possible

consolidation
Chart courtesy of tradingview.com

The top metal couldn’t break below the trendline support of a Bear Flag (orange) and then quickly restored most of its losses coming back above $1200. It is interesting that the forecasted drop unfolded quite differently in each metal. Silver tagged the earlier trough, but gold failed even to breach the vertically sloped trendline. It looks like strong demand appeared right at the round number of the gold price in the $1200 area. Continue reading "Gold Extends Consolidation Giving Silver Another Chance"

Gold & Silver: Falling Knives

Silver has failed to complete the second leg up as it couldn’t break above the August top of $15. It is interesting that this misbehavior of the white metal didn’t surprise you as the majority of you had bet last week that silver would fail and drop below $14.2. It’s impressive how accurate your forecast was!

In this post, I would like to update downside targets as we should be prepared for the resumption of the drop in metals after pullbacks have been finished.

Chart 1. Gold Weekly: Bear Flag Targets Bottom

falling knives
Chart courtesy of tradingview.com

Last week I reminded you of the big range of trade, which requires the retest of the downside of the range to complete the setup. Continue reading "Gold & Silver: Falling Knives"

Silver Slows Saving Gold From Collapse

Chart 1. Gold Daily: Former Support Retested, Another Spike Is Possible

pullback
Chart courtesy of tradingview.com

Gold has finally reached both the AB/CD target and the former support area of $1237 (gray dashed line) as it was forecasted last month in this chart. The metal hit the maximum of $1243 on the 26th of October and then dropped like a rock as was also anticipated after the completion of a pullback. Last Wednesday the price established a low of $1212 losing $31 (-2.5%) from the top. But at the end of last week, gold restored almost all of its losses, closing just below the former support at $1233.
Continue reading "Silver Slows Saving Gold From Collapse"

Gold & Silver: Fly or Die

The precious metals are busy finishing the anticipated pullback to the former support, which is almost within our grasp on the short-term charts. So, let it go and in the meantime we can look into the bigger charts with higher time frames to update the outlook beyond the short-term horizon.

Chart 1. Gold Monthly: 1122/1375

Gold Shines
Chart courtesy of tradingview.com

The monthly gold chart above answers some critical questions. The first one, why gold reversed ahead of $1000? The answer is the red horizontal line, which was set at the 2008 top and acted as strong support and breakdown of it would unleash severe volatility into the market as the next level of serious technical support is located in the $700 area (2006 top/2008 bottom). Continue reading "Gold & Silver: Fly or Die"