Central Banks Keep Buying Gold When You Are Not

Aibek Burabayev - INO.com Contributor - Metals


Gold is a unique asset class, despite being uninteresting from a volatility investing perspective. I mean, it's currently sideways amid a soaring equity and dollar value, but it is still interesting for selected market participants for its safe haven status and diversification purposes.

We all have different time frames that we use, common investors use daily, weekly and monthly charts and the quarter to year perspective when they summarize the profits or losses. And so do the public companies when filing their earnings reports every quarter. And for these type of investors, Gold's dynamics in recent years have been frustrating as it is has been totally unmoved month by month, making investment unpromising.

SPDR vs. Gold
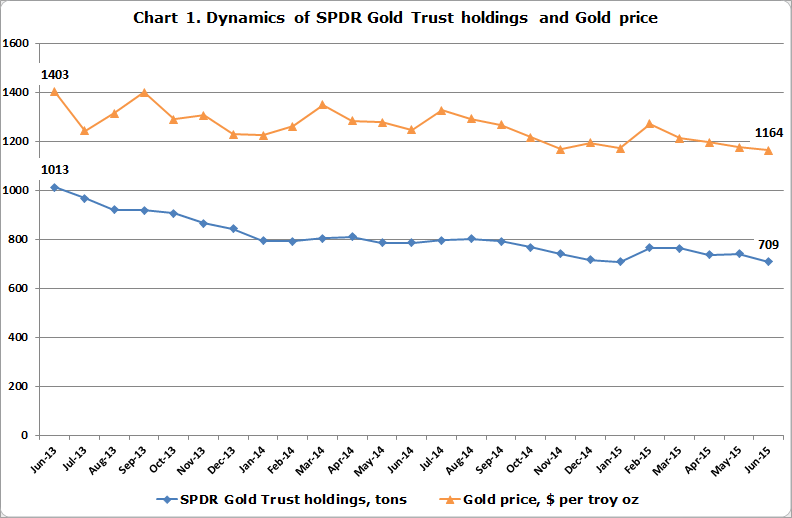
Data courtesy of www.spdrgoldshares.com

On the above monthly chart, tailored especially for INO.com readers, I want you to see for yourselves the direct relationship between Gold prices and the demand for ETF holdings. For 2 years as depicted on the chart, Gold lost 17% of its total value. Meanwhile the SPDR Gold Trust holdings lost 22% of its total value, almost matching dynamics. The holdings fell even more than the Gold price did telling us about worsening investors' sentiment for Gold. Remember the old words that "the Fear has a large shadow". The holdings were falling, gradually neglecting upswings in the Gold price, and only this January did the holdings pick up from 709 to 763 tons amid Gold's price growth from $1172 up to $1273. But this outstanding move proved to be short-lived, and both indicators fell back to the lows.

On the contrary, the central banks are buying Gold despite the sideways market. Continue reading "Central Banks Keep Buying Gold When You Are Not"

Buy Gold For Euros, Sell Copper For Dollars

Aibek Burabayev - INO.com Contributor - Metals


Gold/EUR Is A Buy

XAUUSD/EURUSD
Chart courtesy of Tradingview.com

In my January post, I gave the recommendation to buy Gold versus the EUR at 1022 EUR, with a target for inverse Head and Shoulders pattern at 1208 EUR. As seen in the above monthly Gold/EUR chart, the target hasn't been reached so far, but the maximum advance of 138 EUR (14% between 1160 and 1022 EUR) was significant. Today I will update you on that idea with a new pattern that I found on the chart.

For 10 years, the Gold/EUR has been in a long-running uptrend (highlighted in green). The price had been elevating all the way up from 2005 charting clear zigzags and peaked only in 2012 at 1384 EUR level. Then we saw almost a 40% sharp fall from 1384 down to 856 EUR minimum. At the end of 2013, Gold touched the downside of the trend and one month later, at the start of 2014, the market rebounded from the support and found resistance at the magic 1000 EUR level where the price bounced off into a sideways consolidation between 900 and 1000 EUR. Continue reading "Buy Gold For Euros, Sell Copper For Dollars"

White Metals: Buy In May And Go Away!

Aibek Burabayev - INO.com Contributor - Metals


Platinum Monthly

NYMEX_EOD:PL1
Chart courtesy of Tradingview.com

The old "Sell in May and go away!" saying is not working these days with precious metals. Both Gold and Silver did very well, moving upside beyond recently unforeseen levels in May.

As seen in the above monthly chart, Platinum is still in a long correction from the summer of 2011 after it hit $1918. Platinum lost almost half of its price, searching for the bottom for the last 6 months. It was a hard time for the traders, as stops were hit both in longs and shorts, but what is worse is that most traders could lose patience and belief in the metal. Continue reading "White Metals: Buy In May And Go Away!"

Gold Ratios: One Is Free, The Other Is Next!

Aibek Burabayev - INO.com Contributor - Metals


Gold/WTI Ratio: Free To Fly!

Gold/WTI
Chart courtesy of Tradingview.com

Today for the first time I will analyze this crazy ratio. Just look at the monthly chart above, compared to the dead market in the direct Gold/US dollar cross it is so wildly volatile. It jumps to either side easily like a bullet ricocheting.

This ratio is contained within a very wide range between 6 and 29 WTI barrels per troy ounce of Gold, highlighted in two blue parallel lines. For 12 years, Gold had been weakening compared to WTI Oil (highlighted by falling orange trendline). In between, only once in 1998, we can see a false break up of the downtrend which quickly lost its momentum and the ratio fell back below the line. Gold was falling despite the growing Gold/USD price. The metal almost doubled its price, but at the same time it appeared at the bottom of the ratio and what is more surprising is that when Gold tripled its USD price, it again touched the bottom at 6 barrels per troy ounce. Indeed, it was an Oil boom, not a Gold boom. Continue reading "Gold Ratios: One Is Free, The Other Is Next!"

Gold And Silver Monthly: Monumental

Aibek Burabayev - INO.com Contributor - Metals


Comparison of Dollar Counterparts

4H Dollar Chart
Chart courtesy of Tradingview.com

In the above monthly comparison chart, I put in all of the main Dollar rivals and the Dollar index itself, which is shown inverse (100 was divided into DXY). As we can clearly see, all instruments fell dramatically last summer and didn't stop in the autumn of 2014. The black rectangle shows the area where Gold started decoupling with the rest of the Dollar counterparts. It was last September when Gold stopped falling. EURUSD is the most precise copy of the Dollar Index. Crude oil had slightly different behavior last month with less downside momentum. Therefore, all trade setups for more than half a year couldn't be accurate if they were based on pure Dollar dynamics. Gold stalled in the past waiting for a clear and powerful signal to break out of current the sideways action. The main question is, Continue reading "Gold And Silver Monthly: Monumental"