Maximizing Seasonal Trading Profits

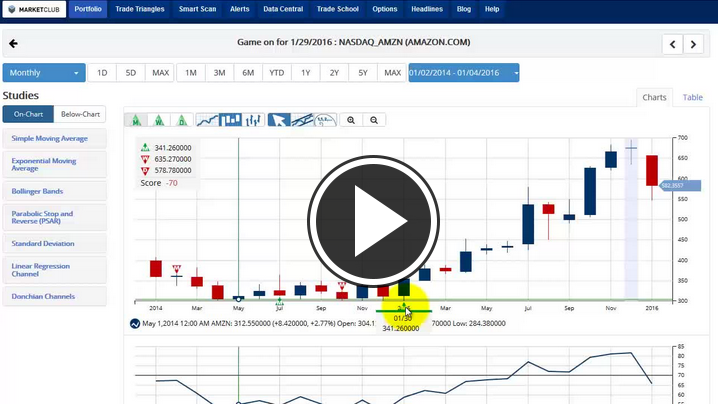
Sheldon Knight has spent years fine-tuning his methods for pinpointing market direction for stocks and futures. In this video, you will discover how this top technical analyst combines day-of-week and day-of-month price patterns with first notice day effect to produce what he calls "the ultimate seasonal indicator".

You will also learn the money management method that he uses to dramatically improve his profits while reducing his risk at the same time.

WATCH NOW: Maximizing Seasonal Trading Profits

Best,
The INOTV Team

USDJPY: "Diving" For Opportunity

By: Elliott Wave International

On a recent vacation to the Yucatan, my friend decided to get certified in scuba diving.

I, on the other hand, prefer breathing my air above water! But I did tag along with her to one of the classes, anyway. She learned how to handle and interpret all the various diver gauges: gas pressure, submersive pressure, depth, and on.

The one feature all those indicators had in common was a bold, red line to indicate the level the diver must obey to stay out of danger.

That's when it hit me: Scuba-diving is a lot like financial markets. Investors and traders jump in -- and use an array of safety gauges to keep them on the right side of price action.

Well, at least those investors and traders who use technical market indicators. For them, those bold, red lines indicating the point of danger -- those are equivalent to the most critical component of market analysis: protective stops. The second prices cross this line, it's time to "swim back up to the surface" and safely re-adjust your position.

For any investor/trader, then, the ultimate goal is to clearly identify these life-"lines" ahead of time, before jumping in. That, dear friends, is where our newest, FREE report "How to Set and Manage Stops With the Wave Principle" comes in.

Here is an excerpt: Continue reading "USDJPY: "Diving" For Opportunity"

Weekly Futures Recap With Mike Seery

We've asked Michael Seery of SEERYFUTURES.COM to give our INO readers a weekly recap of the Futures market. He has been Senior Analyst for close to 15 years and has extensive knowledge of all of the commodity and option markets.

Michael frequently appears on multiple business networks including Bloomberg news, Fox Business, CNBC Worldwide, CNN Business, and Bloomberg TV. He is also a guest on First Business, which is a national and internationally syndicated business show.

Crude Oil Futures

Crude oil futures in the March contract are trading higher for the 4th consecutive trading session up another $.50 at 33.72 a barrel after settling in New York last Friday at 32.19 hitting a 3 week high. I’ve been sitting on the sidelines in this market for quite some time as a short-term bottom around $28 looks to have occurred in my opinion with the next major level of resistance abound $38 as OPEC is hinting at a possible production cut sending prices up about $5 in the last two weeks. Crude oil prices are trading above their 20 day but still below their 100 day moving average telling you that the short-term trend is mixed so look at other markets that are beginning to trend with better potential at the present time. The U.S dollar continues to hover around 99 giving very little guidance in the short-term as this market is based on OPEC and overproduction at the current time as a relief rally is underway in my opinion. Continue reading "Weekly Futures Recap With Mike Seery"

Using Fibonacci Symmetry To Layout Your Trading Battleplan

Are you under the assumption that if a trading plan is not an A+B=C, formulaic approach then it's useless? Join me in this 6-minute video as I explore a subjective approach to the markets used by some of the greatest living traders. I'll show you that interpreting data and making the best possible decision is your primary goal in trading. And if a plan goes wrong, and many times it does, how to lay out a contingency plan to protect your capital.

Using the tools of the wave principle and Fibonacci I analyze the NASDAQ 100. Specifically, I look at symmetry at work in the markets and how to act right now.

Learn more about TradingAnalysis.com here.

Plan Your Trade, and Trade Your Plan,
Todd Gordon

Things Got Pretty Ugly For Amazon (NASDAQ:AMZN) Yesterday

Yesterday was a doozy of a day for buyers of Amazon. First the stock rallied and closed out the day at $635.35 for a gain of $52 (8.91%) in regular trading hours. Great day, right?

After the close, Amazon.com, Inc. (NASDAQ:AMZN) released its Q4 earnings which were a big market surprise. In a matter of minutes, Amazon dropped over 13%, closing at $550 in after-hours trading. That is a swing of $85.00 or over 20% in one day!

I outlined on Wednesday that I was neutral on Amazon as the weekly and monthly Trade Triangles were in conflict. When you see a conflict between the weekly and monthly Trade Triangles, it indicates a sidelines position for the stock.

It's the end of the week, end of the month and it's time to talk about the January barometer. Continue reading "Things Got Pretty Ugly For Amazon (NASDAQ:AMZN) Yesterday"