Good day, let me begin by welcoming the hundreds of new members who have just joined MarketClub in the last few weeks. I welcome you and wish you every success with MarketClub.
Today I would like to share with you one of the many lessons that are available to you as a MarketClub member.
Technical analysis has been around for a long time. It has been said that Japanese rice traders kept hand charts over 200 years ago to track the price of rice. More recently in the 50's, technical analysis began to gain acceptance, and the 70's could be called the golden age of technical analysis. Technical analysis is now widely regarded as mainstream, no longer do traders and investors think of technical analysis as Ouija boards and funny-sounding chart formations. Technical analysis is a serious tool that you can use to make money.
Fundamentals are important, but technical analysis, in my humble opinion, is more important because it provides you with timing which I think you'll agree is everything in life.
I'm going to be looking at one of my favorite indicators that can help you enter or exit a market on favorable terms. This tool also works extremely well with the market-proven Trade Triangle technology.
Today's lesson is on the Fibonacci Sequence.
Leonardo Fibonacci was a mathematician born in 12th century Italy. His study of Fibonacci numbers (a sequence of numbers where each number is the sum of the two previous numbers) is often applied in technical analysis to find support and resistance in stock charts.
This timeless lesson I learned many years ago when I was a member of the Chicago Mercantile Exchange trading in pits. It is one tool that has stood the passage of time and one that I still use today.
How this amazing 12th century Italian mathematician figured this out is way beyond my pay scale, but I can say without hesitation that it works.
Watch the lesson here and then leave a comment.
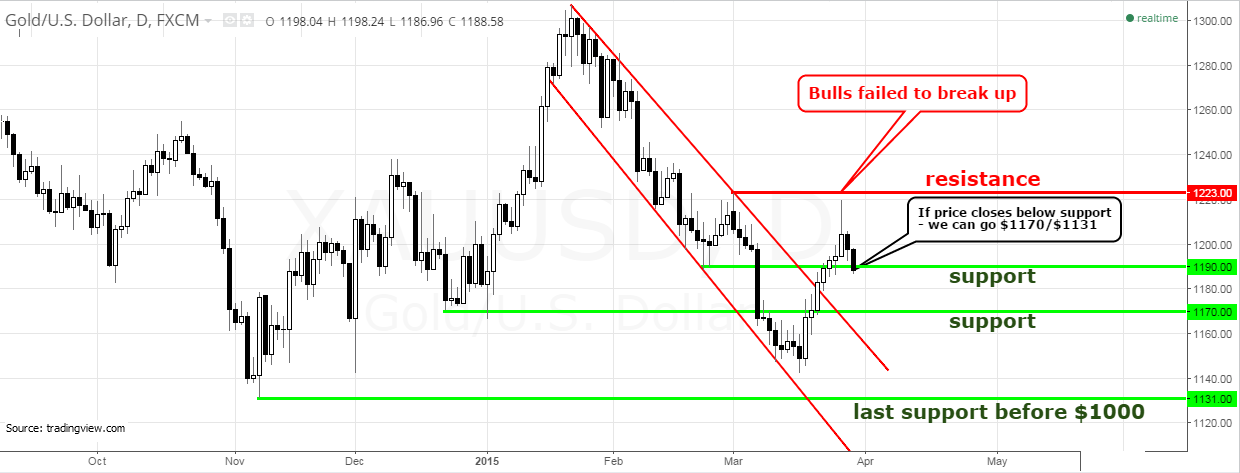
How To Use Fibonacci Retracements
The principle behind a Fibonacci retracement is that after a stock moves upward or downward, the price will often retrace or correct some of this movement. Many technical analysts believe that the amount of retracement will often correspond to one of the Fibonacci levels. The five horizontal lines represent percentages of 100%, 62%, 50%, 38% and 0% (with 62 and 38 being Fibonacci numbers).
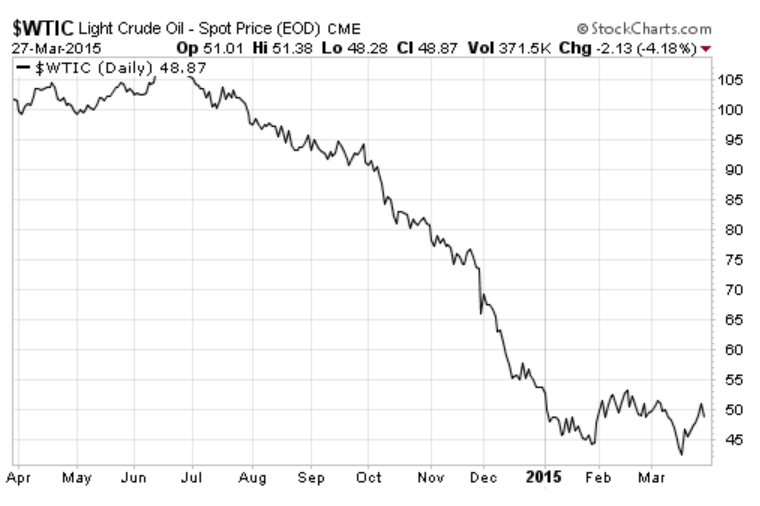
The Fibonacci sequence works on intraday charts, daily charts, weekly and monthly charts. I do not know why it works in the financial markets. Through all my reading and research, I've never found a reason other than it works in nature.
I'm going to show you just how easy it is to use Fibonacci in your own trading.
This is one lesson you do not want to miss, it will open your eyes as to how and why markets move. One of the many benefits of Fibonacci retracements is that it will allow you to enter a position with very little risk. That is a big plus in today’s markets.
So enjoy and learn from this valuable lesson and yes, take a look at some charts after watching the video and apply what you learned using MarketClub's Fibonacci tool.
By all means, please feel free to share your findings on the blog with your fellow members. You can leave your comments and findings just below this post.
Every success with MarketClub,
Adam Hewison
President, INO.com
Co-Creator, MarketClub


 We created MarketClub to help traders employ the strategies that I, Adam, have used for over 30 years to make myself and my clients a lot of money. It's an awesome service that will allow you to phase out your financial advisor and make educated trading decisions on your own.