Why It's Time To Buy Barrick Gold Corporation (NYSE:ABX)

Hello everyone, Adam Hewison here coming to you from the digital studios of MarketClub. Yesterday, the Barrick Gold Corporation (NYSE:ABX) had a major trend change to the upside signaled by a new green monthly Trade Triangle. It's the first buy signal ABX has had since it began its move on January 7, 2016. At that time the signal was it $8.33 and the market moved as high as $23 before pulling back.

Today I have put together five different charts that show why I believe Barrick Gold is headed significantly higher.

About This Stock

Barrick Gold Corporation (NYSE:ABX) engages in the exploration and development of gold and copper properties in the United States, Canada, Australia, Argentina, Chile, Peru, the Dominican Republic, Papua New Guinea, Tanzania, Zambia, and Saudi Arabia. It primarily explores for gold, copper, and nickel deposits. The company's main properties include Cortez, Goldstrike, Pueblo Viejo, Lagunas Norte, and Veladero. As of the end of 2015, ABX had proven and probable gold reserves of 91.9 million ounces; and 11.7 proven and probable copper reserves of billion pounds. Barrick Gold Corporation was founded in 1983 and is headquartered in Toronto, Canada.
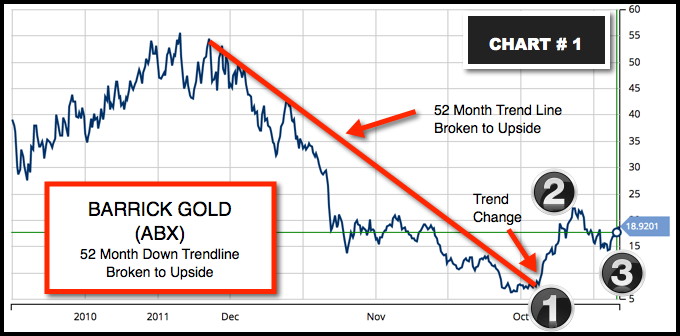
Chart #1

In chart number one can see that Barrick Gold broke over a 52-month long-term negative force line (1) and moved as high as $23 a share (2) before pulling back 50% (3).

Barrick Gold Corporation (NYSE:ABX)

Continue reading "Why It's Time To Buy Barrick Gold Corporation (NYSE:ABX)"

Three Indicators That Say Gold Is Headed Higher

If you haven't been paying attention to the gold (NYMEX:GC.Z16.E) market, you may have missed one of the most interesting moves of the year. As all the major indices have been trending lower gold has been doing just the reverse.

Here are the three positive indicators I see.

1. The weekly Trade Triangle is now green. It triggered on 11/01 at $1281.10

MarketClub's Trade Triangles Daily Gold Chart

Continue reading "Three Indicators That Say Gold Is Headed Higher"

Yellen, Yahoo and Yikes!

Hello MarketClub members everywhere, it's the last day of trading for the week and it has been quite a week.

Yesterday, Janet Yellen, the head of the Federal Reserve Board, came out late in the day and said that things were getting stronger economically and that the job picture was improving. It was a rare appearance by Ms. Yellen as normally the head of the Federal Reserve does not come out to make any statements, except official ones. That one statement alone was enough to evaporate most of yesterday's losses in overnight trading. It is all about free money folks and the Federal Reserve has no more rabbits to pull out of its hat.

MarketClub's Mid-day Market Report

Verizon Communications Inc. (NYSE:VZ) indicated that it plans to make a bid for Yahoo! Inc. (NASDAQ:YHOO). I find it interesting that the Trade Triangles picked up that something that was going on with Yahoo on March 29th, 10 days before the Verizon news came out. This is one of the big secrets in the market, someone (and insider) always knows what’s going on. Because of this inside knowledge, they see an opportunity to make money and they buy either options or shares in that company, in this case, Yahoo. That translates into market movement and plays into the algorithm used for the Trade Triangle technology. Yahoo is up this morning in early trading and I believe that this stock can move higher from current levels.

It seems as though 100 point swings in the Dow have become the norm at least for the moment. However, as you know, I tend to look at the bigger picture and what's going on. I do that by looking at how the markets are closing compared to last Friday's closing. Continue reading "Yellen, Yahoo and Yikes!"

I Have An Uneasy Feeling Today

Hello MarketClub members everywhere. I have to say that I have an uneasy feeling about the markets today. As you know, for some time I have been neutral to negative on the major indices based on the monthly Trade Triangles. As I pointed out yesterday, the first cracks in the armor came when the indices fell below their PSAR levels. The only exception was the NASDAQ, whose PSAR comes in today at 4734.77. Should the NASDAQ (NASDAQ:COMP) trade below that level today, it would indicate that all indices are now vulnerable to a fairly sharp selloff.

Indices: I will be looking at all the major indices and indicating where they could potentially slip to in the weeks ahead. Also, Janet Yellen, head of the Federal Reserve, will be talking about the economy today. I have been a vocal critic of the Fed's policy for some time and believe the Fed is in over its head and doesn't quite know how to resolve the current continued weakness in the US economy. Continue reading "I Have An Uneasy Feeling Today"

Do Quarterly Charts Hold The Key?

Hello MarketClub members everywhere! With the markets closed tomorrow for the Easter holiday, today is the end of the week. The question now is, how comfortable are investors going to be over this long 3 day weekend?

One of the tools I love using in MarketClub is the quarterly charts. I'm pretty confident in saying that very few traders ever watch these charts, but they should. They can provide you with a broad overall picture of the long-term trend that you just can't see on daily and weekly charts. I think you'll be surprised by what the quarterly charts are revealing today.

Below I have outlined last week's close, as well as key levels for the PSAR. Perhaps by the time you read this post the market will have already broken the Parabolic support levels. If that is the case, I would expect further weakness in the market next week. Continue reading "Do Quarterly Charts Hold The Key?"