Last month I spotted the reversal Head & Shoulders pattern on the daily gold chart and shared it with you. Let’s see how it played out.
I entered the replay mode on the chart below and deleted the bars that appeared after the previous post to show you what I was expecting from the Head & Shoulders pattern. I would like to add more educational annotations for you in this post.
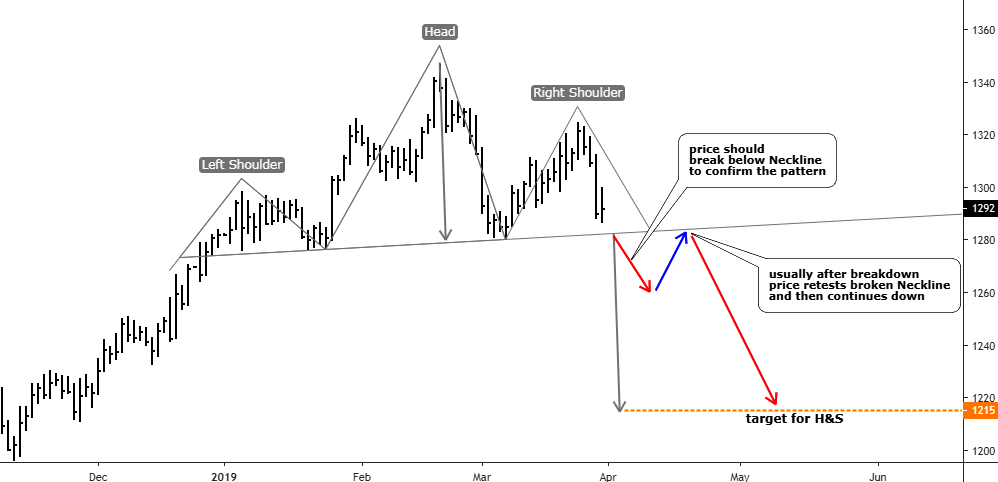
Chart courtesy of tradingview.com
The previous annotations were switched to gray except the target level for the Head & Shoulders pattern. So, what I was expecting to appear on the chart? First of all, there should be a breakdown below the Neckline, which would confirm the pattern (short red down arrow). Usually, after the breakdown, the price retests broken Neckline (blue up arrow). Only then, the market continues its move in the direction of a target (long red down arrow). Continue reading "Gold Update: Calm Before Storm?"