S&P 500 Consolidates, Is Another Drop Ahead

Aibek Burabayev - INO.com Contributor - Metals - S&P 500 Consolidates


In this post, I will share with you two maps as the S&P 500 consolidates to address two questions that are probably on your mind these days. The first is related to the long-term trend, shall we consider that significant ten percent drop that started at the end of January as a threshold for the long-term Bear Face? And the second question is related to the current situation, will this robust recovery continue further?

Let’s be diligent and answer those questions one by one.

Chart 1. S&P 500 Monthly: Consolidation Not A Reversal Yet

S&P 500 Consolidates
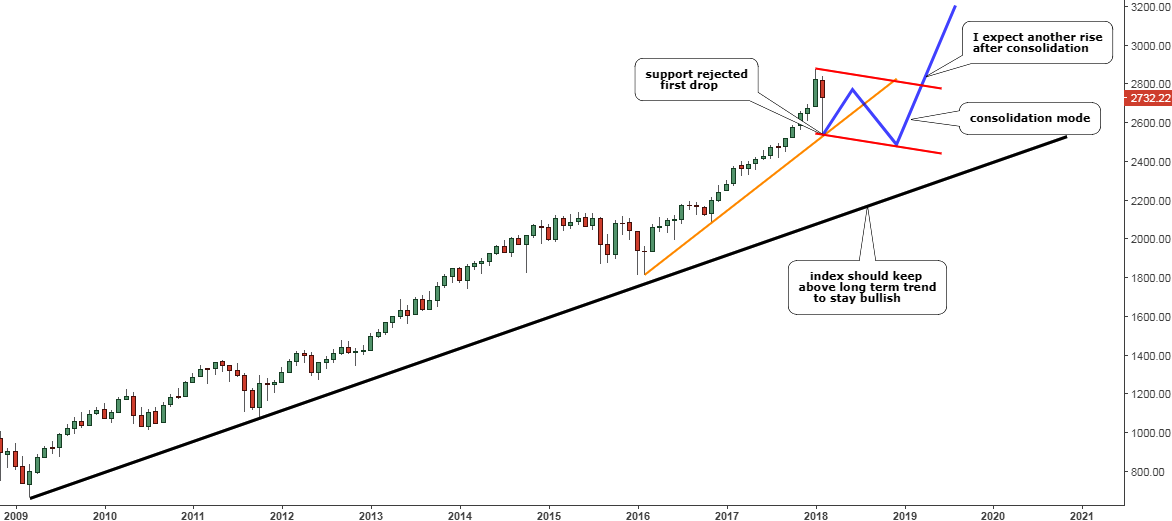
Chart courtesy of tradingview.com

First of all, I would like to draw your attention to the black long-term trendline support, which starts post Great Recession period. The S&P 500 is far above this trigger, and I guess that even the current consolidation could hardly reach it. So, for the long term Bear Face to start sellers should push the index below that trendline, which currently sits at the $2100 mark. As this is not the case now, there is no reason for panic then. Continue reading "S&P 500 Consolidates, Is Another Drop Ahead"

With All Eyes On Equities - You May Have Missed This Sleeper

Call it the Trump Rally, or any name you like, but the stock market certainly came alive when the election swung in Donald Trump's favor. While all eyes are on equities, other things are going on in other markets that you should be preparing for.

Today, I'm going to take an in-depth look at the gold market that has been out of favor the last several years. Gold (FOREX:XAUUSDO) did enjoy a strong rally in the first half of the year and was a top performer. Since moving close to $1400 in July, gold has steadily eroded down to around the $1,180. The question now is, is gold going to continue on the downside or begin to stabilize and start looking forward to what could be an inflationary future? With that in mind, I decided to look at three market keys that could unlock gold and determine its future.

Long-Term Negative Force Line

FIG 1. I have drawn a long-term down sloping trendline starting from gold's all-time high of around $1900 and connected it to several other high points over the years. To be a valid technical trendline, it must touch three points. When that happens, it confirms the validity of the line. The long-term negative force line seen in FIG 1 is the dominant and number one element that will determine which way gold is headed in the future. I would consider a move over the $1375 - $1400 (3) levels on spot gold as a major signal that gold has changed direction to the upside. When this happens, and it will happen sometime in the future, gold will enter into a multiyear bull market. FIG 1 is the number one technical aspect for gold and should be watched closely in 2017.

Gold (FOREX:XAUUSDO) Trendline

Continue reading "With All Eyes On Equities - You May Have Missed This Sleeper"

Gold And Silver: Just K.I.S.S!

Aibek Burabayev - INO.com Contributor - Metals


Old friends and new guests, thank you very much for the comments and discussions regarding my post last week. One thing was clear… you prefer classic trend line charts! I will try to keep it short and simple from now and on. I will keep Elliott Wave for more liquid and crowd trending markets, like stocks and indices, where they work better.

Gold


Chart courtesy of Tradingview.com

Last week Gold was very tricky compared to the other Dollar rivals. For example, the Euro and Crude oil are creeping up, while Gold did the opposite and squeezed out buyers. Yesterday, sellers couldn't escape either and got stopped out.

The price touched the downside for the second time and Gold shaped the Descending Triangle pattern which is highlighted in red. A breakout happened today above $1200. It means that we will watch the continuation of an uptrend (highlighted in blue). The target is calculated as a sum of the breakout and the height of the Triangle, which is located at $1246 area. Continue reading "Gold And Silver: Just K.I.S.S!"

Is This Apple's Secret Or One Amazing Coincidence?

Hello traders and MarketClub members everywhere. Today, I am going to be looking at what could be an amazing coincidence in Apple. It could also be a profitable opportunity for alert traders. Before we get into that, I hope you all had a chance to look at yesterday's special post on gold. If you didn't, please check it out right here.

It is the last day of the trading week, with both the stock and bond markets closed tomorrow for Good Friday.

I want to lay out for you a potential trading scenario for Apple stock. To that end, I have shown on the below daily chart what I think is going to happen in the future.

In approximately 7 days from now, give or take a couple of days, Apple should offer an amazing buy opportunity if this scenario plays out like I think it will.

Apple Daily Chart

It appears after making a high, Apple sort of drifts back for the next 33 to 34 days before it once again has a sharp upward move. If that same scenario plays out this time, then somewhere between the 10th and 12th of April would be in ideal time to look at getting long stock in Apple. On April 10th, Apple is going to begin taking preorders for its new Apple Watch, coincidence maybe. I'm sure there will be legions of loyal Apple fans waiting and wanting the latest gadget from Apple. Continue reading "Is This Apple's Secret Or One Amazing Coincidence?"