

At the end of last month both metals finished the first move up of the second, larger leg breaking below the signal line support mentioned in my last February post. And in my previous post last week I showed you how gold could help silver traders to jump ahead of the crash as silver lagged behind the gold.
Today I am going to update the charts to see what’s going on there. And the first up is the 4-hour gold chart where I would like to share with you a zoomed in picture.
Chart 1. Gold 4-Hour: CD=AB
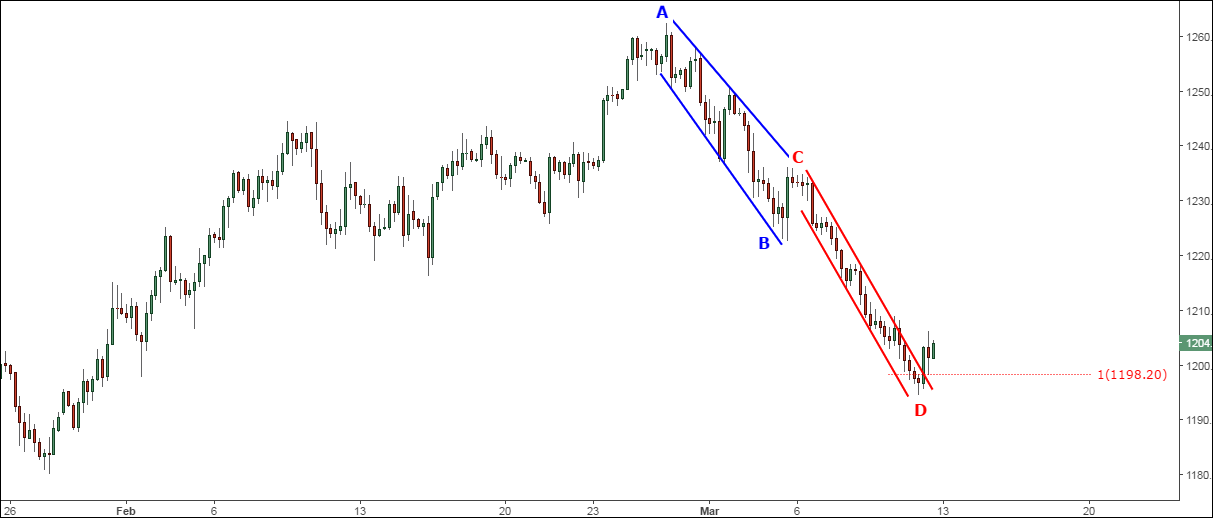
Chart courtesy of tradingview.com
I do not usually post lower time frame charts, but this time I made an exception to show you another example of both the perfect AB/CD segments’ work and the Fibonacci ratios involved in the complex structure of any move. Besides that, it's also a perfect work of trends.
The first move down is isolated with the blue slightly expanding trend channel labeled as AB segment. The zigzags within it were quite wide as buyers were trying to buy dips to keep the market going up. The strong green bullish candle on March 3rd was the last shot of this kind. And then the Bulls surrendered as strong red bearish candles started to appear within the red trend channel labeled as the CD segment, which is narrower than the AB segment. The CD segment made a small extension in length compared to the AB segment as the price dropped below the $1998 level where both segments are equal.
And then on the Friday we got the first strong bullish candle despite better than expected Non-Farm Payrolls. That candle broke out of the red channel. The next candle made a pullback to the broken former resistance and the market closed above those two previous candles. For the bigger perspective, let’s move on to the next chart with daily candles.
Chart 2. Gold Daily: Half Lost – Enough?
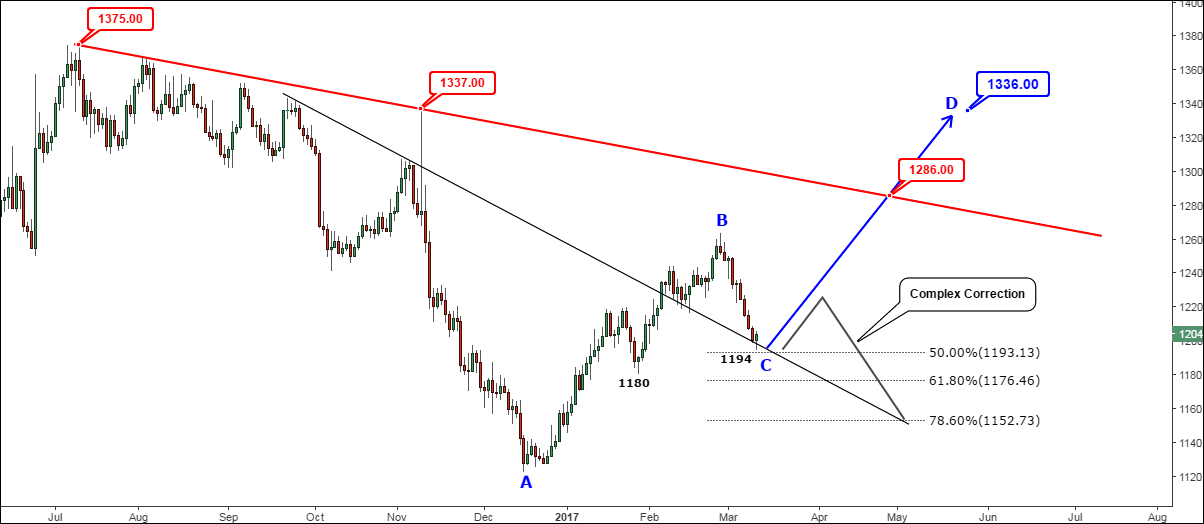
Chart courtesy of tradingview.com
The numbers are everywhere as the perfect work of the Fibonacci ratio shown in the first chart above is supplemented with the Fibonacci retracement levels and the beautiful geometry of the trends on the daily chart. As you can see in the chart above, the current drop stopped right on the edge of former resistance (black) ahead of 50% Fibonacci retracement level.
We have two options from this low. The first scenario considers that the correction has been simple, consisting just of two smaller trends, then we can add the length of the AB segment to the current low to set the upside target as highlighted by the blue arrow in the CD segment at $1336 level. This target is just $1 below the previous top established in November. The first barrier is located at the red trend line resistance at $1286 level.
Another scenario is possible if we would have a complex correction as highlighted with a gray zigzag. It implies the upside correction and another drop down to lower Fibonacci retracement levels and lower touch point of the black trendline. The break below the $1194 would give us the first signal that bears are still around.
Chart 3. Silver Daily: Lost More Than A Half
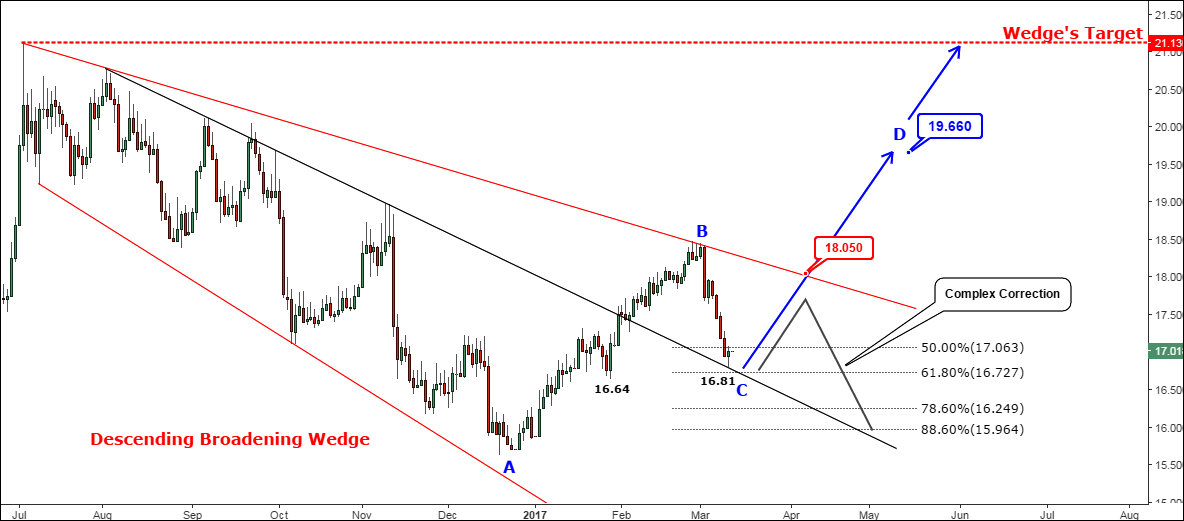
Chart courtesy of tradingview.com
This time these metals exchanged their chart behavior as gold has a neat structure while silver has broken 4-hour graph and that’s why I didn’t put it here. But anyway, I calculated the ratio between 4-hour AB and CD segments (not shown here) – the CD segment hit an extended 1.414 (Fibonacci number) ratio. That’s why the silver lost more than a half and almost hit the 61.8% Fibonacci retracement level on the daily chart above. But the perfect geometry still works here as well. The drop was also stopped at the black trendline as in the gold chart. Another good word for silver is that it previously hit a higher target compared to gold in the first leg up before the current correction. It’s a normal behavior as it reflects the preferences of market participants for these metals at any given time.
Two options for silver look as follows: 1) In case of a simple correction, which could be over now the target for the next leg up is set at the $19.66 level where the blue CD segment is equal to AB segment. But we remember that this metal has an ace in the hole and the extended target could hit the Wedge pattern’s goal at the $21.13 mark. 2) In case of a complex correction (gray zigzag) we could hit lower Fibonacci retracement levels. The drop below the $16.81 would be the first trigger for it.
Dear readers, I appreciate your warm feedbacks and the active participation in voting and this time I am eager to know what the most interesting topic is for you.
Intelligent trades!
Aibek Burabayev
INO.com Contributor, Metals
Disclosure: This contributor has no positions in any stocks mentioned in this article. This article is the opinion of the contributor themselves. The above is a matter of opinion provided for general information purposes only and is not intended as investment advice. This contributor is not receiving compensation (other than from INO.com) for their opinion.
Copper
Great article, clear charts, thank you! Inflation index direction correlates with direction of gold.
USD and oil do impact gold price, but don't always determine direction.
Please look at the MACD for any Gold Mining Stock (NEM, GOLD, RJLD, Etc) and you will see somerthing bullish in the making in next few days or weeks with the short term line coming to meet the long term line. I like what I see.
Thanks Ed for taking the time to answer. Now, if I only knew what the hell I was doing with how to invest in ____. I guess I have to follow the trail. ;)))
ok grand counselor, how do we know when to jump in; and, do we pick a combo (i.e. gold, silver, mining, etf, etc)? And, for the big question (Fibo ratios n/a): when do we get out of the polluted water?
HK
DJ USD the direction