

Chart 1. Gold Daily: Second to Win but First to Hold
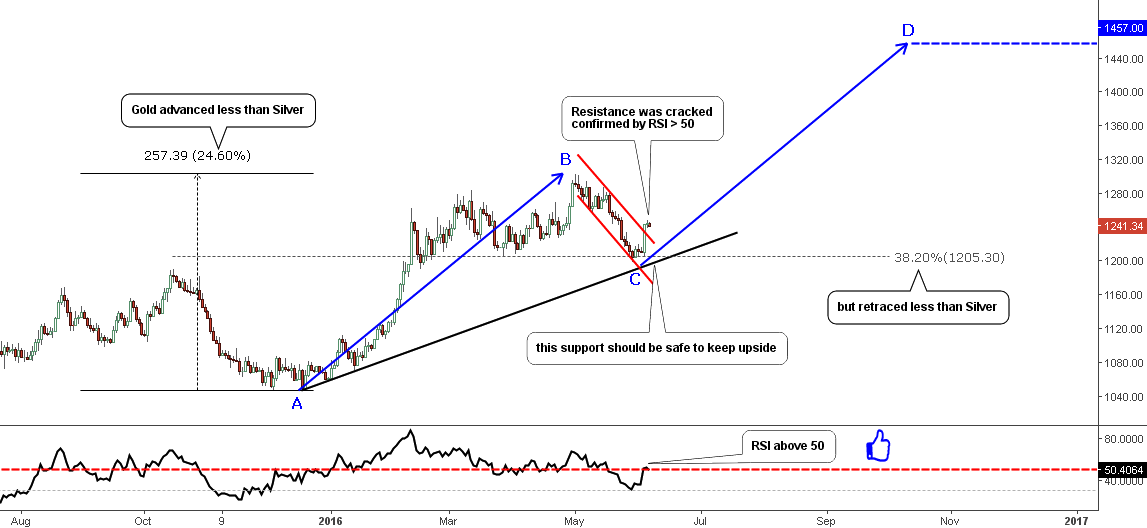
Chart courtesy of tradingview.com
The top metal has was just $4 from reaching the target of $1307 which was set in my March post. It had reached a high of $1303 on May 2nd before it started a one-month long correction anticipated in the same post. The depth of the correction is minimal at 38.2% and is well above the normal retracement area within the 50-78.6% range ($1176-$1101) highlighted in the March post. Continue reading "Gold & Silver: First Pullback"
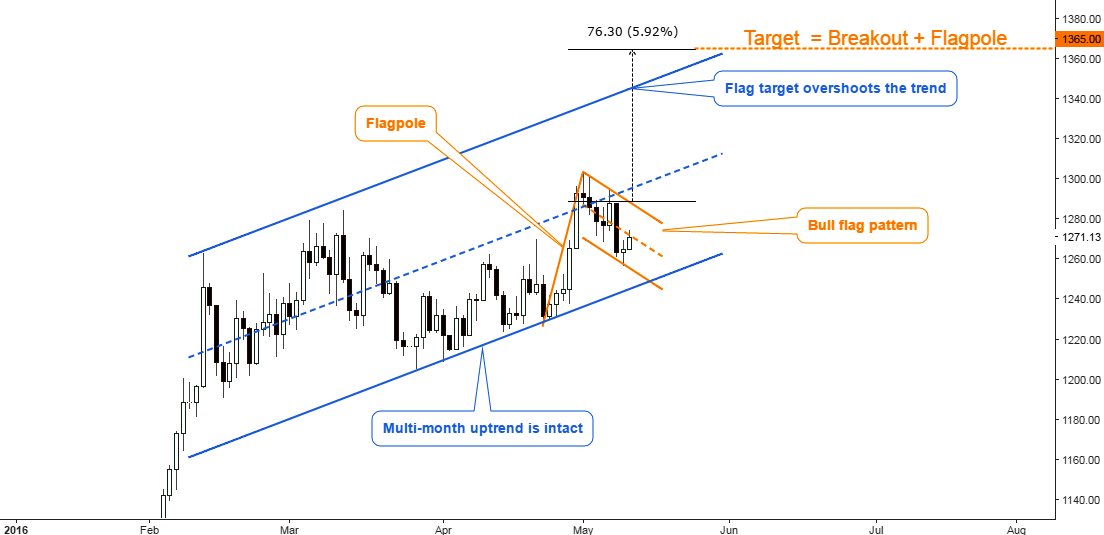
 Do you know how to tell if a market has topped out? Has it hit the bottom? If you know how to look at your chart and pick out a flag or symmetrical triangle pattern, you may have your answer and be able to react accordingly.