Gold/Silver Ratio: "Shines Bright Like A Diamond."
Chart 1: Gold/Silver Ratio Monthly
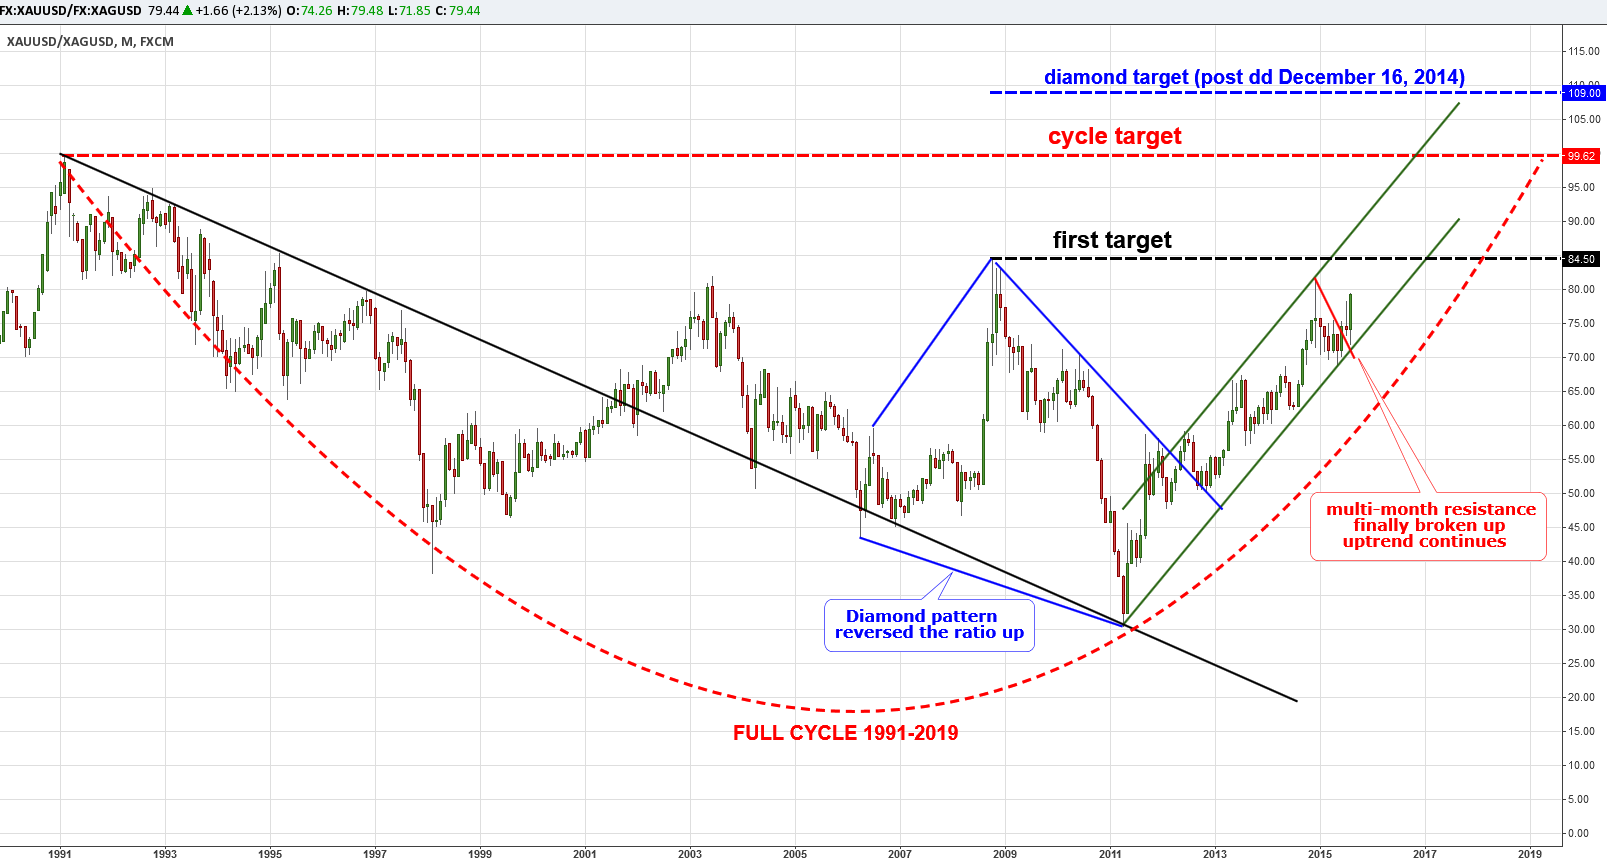
Chart courtesy of TradingView.com
Last December I had written my first post with quite an ambitious target for this ratio at the 109oz level as a possible outcome of a very rare diamond reversal pattern (highlighted in blue lines and the target is highlighted in blue horizontal dashed line). At that time the ratio was at the 72oz level and it has advanced 11% now to the 80oz level. Continue reading "Gold Ratios: Gold Is A Top Killer When You Need Safety"