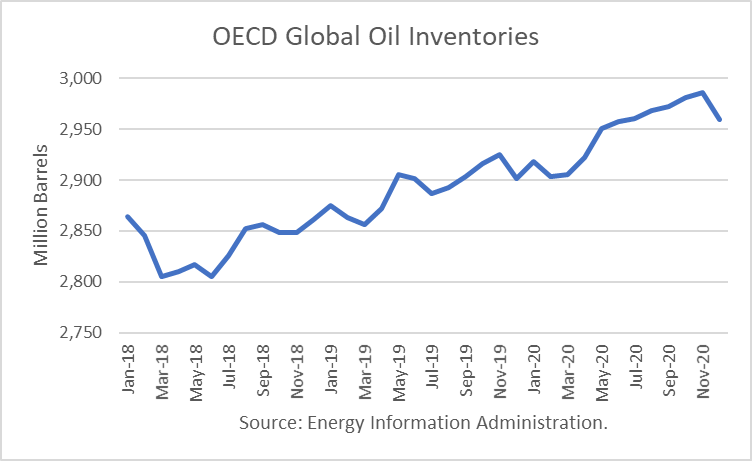
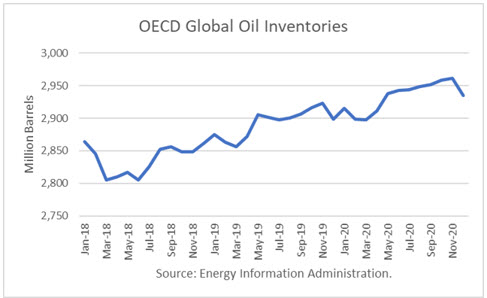
The Energy Information Administration released its Short-Term Energy Outlook for July, and it shows that OECD oil inventories likely bottomed last June 2018 at 2.805 billion barrels. It estimated stocks dipped by 4 million barrels in June 2019 to 2.902 billion, 97 million barrels higher than a year ago.
However, throughout 2019, OECD inventories are no longer expected to rise any further, on balance. At year-end, EIA projects 2019 to be with 2.899 million barrels, 37 million more than at the end of 2018. For 2020, EIA projects that stocks will build 35 million barrels to end the year at 2.934 billion.
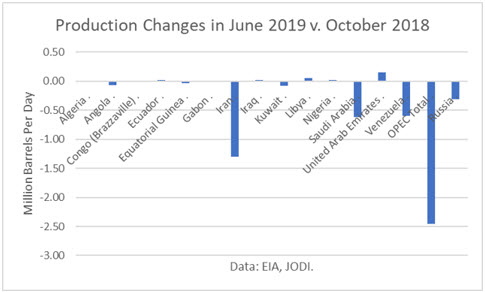
The EIA has revised its estimates for future OPEC production down significantly, given the sanctions on both Iran and Venezuela. For much of the balance of 2019 and 2020, it expects OPEC production to remain under 30 million barrels per day. June was reported at 29.8 mmbd.
OPEC has revised its call (demand) for OPEC oil. For 2020, the average is 29.2 mmbd. Therefore, OPEC must cut supply by another 550,000 b/d from June next year just to balance stocks. Continue reading "World Oil Supply And Price Outlook, July 2019" →