Crude Oil and Bitcoin Hit New Yearly Lows

Hello traders everywhere. For the first time in a year WTI crude oil is traded below $54 a barrel hitting a low of $53.63. Oil fell as much as 6% as fears are surfacing that OPEC's planned production cuts will do little to stave off a surge in global stockpiles.

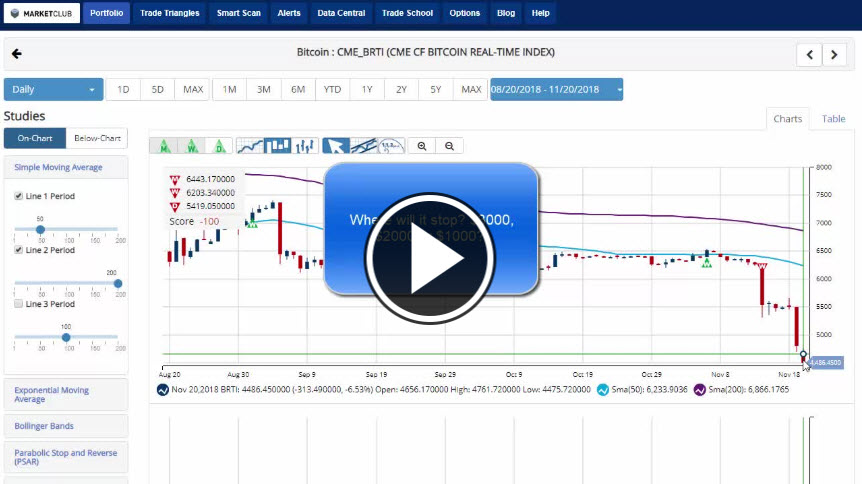
Bitcoin finally made a significant move to break out of the tight trading range that it had been trapped in. Unfortunately for Bitcoin bulls, it was not the move that they were looking for as it dropped almost 13% on Monday and continued lower Tuesday shedding another 4.8% to trade at the new yearly low of $4,547.00. The cryptocurrency is now down more than 60% year-to-date and more than 70% since its all-time high. Where will it stop? $3000, $2000 or $1000?

New Yearly Lows

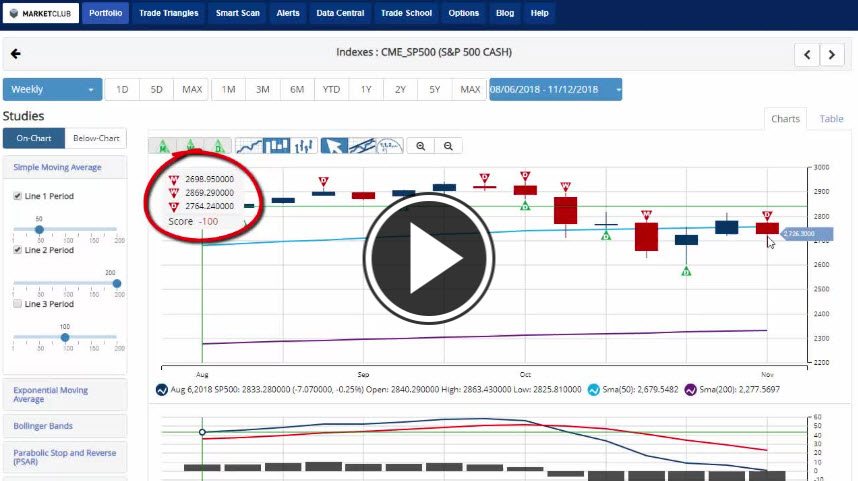
Not to be outdone by oil and Bitcoin, stocks are all continuing the sell-off that started Monday with the S&P 500 dropping 1.6%, the DOW is once again below 25k, shedding 2% and the NASDAQ is trading back below 7,000 losing 1.6%. The recent sell-off has once again pushed the stock market back below the yearly open, shedding all of the gains that came with record highs earlier in the year which has driven all three indexes into correction/bear market territory. It's looking more and more like we have a good to chance to end the year lower unless we get the Santa Clause rally.

Key Levels To Watch This Week:

Continue reading "Crude Oil and Bitcoin Hit New Yearly Lows"

Slowly We Turn... Gold Vs.

Let’s take an in-day snapshot of gold vs. several key competitors (for your investment dollars/euros/yen, etc.) and check the progress in turning the macro from risk ‘on’ to risk ‘off’, cyclical to counter-cyclical.

Gold/Commodities motors along above the SMA 200. The move has been hysterical, and thus looks impulsive. That could mean something as we look back in hindsight one day.

gld.dbc

Gold/Oil has been the driver of the above. Continue reading "Slowly We Turn... Gold Vs."

Weekly Futures Recap With Mike Seery

We've asked Michael Seery of SEERYFUTURES.COM to give our INO readers a weekly recap of the Futures market. He has been Senior Analyst for close to 15 years and has extensive knowledge of all of the commodity and option markets.

Michael frequently appears on multiple business networks including Bloomberg news, Fox Business, CNBC Worldwide, CNN Business, and Bloomberg TV. He is also a guest on First Business, which is a national and internationally syndicated business show.

Silver Futures

Silver Futures in the December contract is trading higher for the 3rd consecutive session up another $0.07 at 14.33 an ounce after settling last Friday at 14.14 up nearly $0.20 for the trading week. Silver prices hit a contract low on November 14th at 13.86 as we are right near a three year and ten year low as the strong U.S. dollar has undoubtedly put pressure on this commodity as I am currently sitting on the sidelines waiting for a trend to develop. Silver prices are trading under their 20, and 100-day moving average as the trend is to the downside, but this market has been very choppy over the last several months in a directionless trend. I'm advising clients to avoid silver and look at other markets that are beginning to trend as I still believe we will have bullish trends come 2019 as I think demand will come back to many commodities sectors, but I don't see anything developing in silver for the next several months. Gold prices are also still hovering around the 1,200 level as that is also experiencing a choppy to lower trend as the precious metals need a weaker dollar not a stronger dollar & until that happens prices will remain depressed.
TREND: LOWER
CHART STRUCTURE: SOLID
VOLATILITY: LOW

Continue reading "Weekly Futures Recap With Mike Seery"

Selling Put Options For Consistent Premium Income

Options can be a great strategy under any market condition as a standalone method or in conjunction with a long-term portfolio to augment long-term positions. Options trading can mitigate risk; provide consistent income, lower cost basis of underlying stock positions and hedge against market movements while maintaining liquidity. Risk mitigation is particularly important given the market wide sell-off throughout October and into November. Maintaining liquidity via maintaining cash on hand to engage in covered put option selling is a great way to collect monthly income via premium selling. Put option selling can also serve as a means to initiate a position via being assigned shares strategically. Heeding critical variables such as historic and implied volatility, implied volatility as it relates to historic volatility along with probability and liquidity, one can optimize option selling to yield a high probability win rate over the long term given enough trade occurrences. I’ll discuss these critical elements and how they translate into high probability options trading to maximize option outcomes regardless of directionality, effectively maintaining a market neutral position. In the end, options are a bet on where the stock won’t go, not where it will go and collecting premium income throughout the process.

Put Options Overview

Covered puts can be implemented as a means to leverage cash on hand to sell options contracts and collect premium income in the process. Contractually, this type of option selling gives the option buyer the right to sell you (the seller) shares at an agreed upon price by an agreed upon date in exchange for a premium (cash payment). An account cash reserve can be utilized for selling covered puts thus not purchasing the underlying security with the end goal of never being assigned shares and netting premium income in the process. It’s important to bear in mind that covered puts shouldn’t be sold unless one wouldn’t mind being assigned shares in the underlying equity if the underlying moves opposite the option directionality and breaks through the option strike price. Additionally, restricting covered put contacts to high quality, large-cap, dividend-paying companies with high implied volatility, high implied volatility percentile and high probability of success (i.e., one standard deviation out of the money) will mitigate risk and decrease the likelihood of assignment to maintain liquidity and add to cash on hand. The end goal is to capture premium income and maintain liquidity which is accomplished before the expiration of the contract via buy-to-close to accelerate the closure of the contract and capture realized gains. Continue reading "Selling Put Options For Consistent Premium Income"

Stock Market On Pace For Big Weekly Losses

Hello traders everywhere. Stocks opened Friday trading higher for the most part but were unable to hang on to those gains as we headed into afternoon trading and after two weeks of gains the major indexes will post big weekly losses. All three indexes are looking at losses of over 2% with the DOW leading the way lower with a -2.6% weekly loss. The NASDAQ is in second place with a loss of -2.5% meanwhile the S&P 500 just checked in with a -2% loss.

For the first time in four weeks, the U.S. dollar will have a weekly loss of -.42%. The move lower came after Federal Reserve Vice Chairman Richard Clarida offered some dovish comments. Clarida told CNBC that central bank's pace of rate hikes wasn't too fast while also saying that the global economy showed signs of slowing. Overall the Chart Analysis Score is +55 with the recent weakness, but it's still on a long-term uptrend.

Big Weekly Losses

Crude Oil has stabilized at weeks end ending its historic slide six-week slide finding support at the $55 level. Oil looks to finish the week with three straight days of gains, but it will still post a big weekly loss of -5.2%. The Chart Analysis Score remains low at -90 indicating that the long-term downtrend still has considerable strength.

Much like oil, gold is looking to finish the week on a strong note with four straight days of gains trading back above the $1200 level and is the only instrument that we track that will post a weekly gain standing at +1% gaining back half of the last weeks -2% loss. Even with the recent daily strength, the Chart Analysis Score remains low at -75 telling you that the overall long-term trend is still strong.

Bitcoin suffered its most significant weekly loss in ten weeks standing to lose -12.8%. However, bitcoin has been and remains trapped in a tight trading just below its 50-day MA. The Chart Analysis Score of -90 tells you that the long-term downtrend is gaining strength and could head lower from here.

Key Levels To Watch Next Week:

Continue reading "Stock Market On Pace For Big Weekly Losses"