Major Alert: Amazon (NASDAQ:AMZN) Flashes Its First Major Sell Signal In 16 Months

In the first 30 minutes of trading today, Amazon.com Inc. (NASDAQ:AMZN) triggered a red monthly Trade Triangle indicating a major trend change in this stock. This could be partly due to Amazon's announcement yesterday that it planned on opening 400 brick and mortar bookstores. So after putting almost every bookseller out of business, Amazon is now going into the brick and mortar business. Could that be a big mistake for Amazon?

Daily Chart of Amazon.com Inc. (NASDAQ:AMZN)

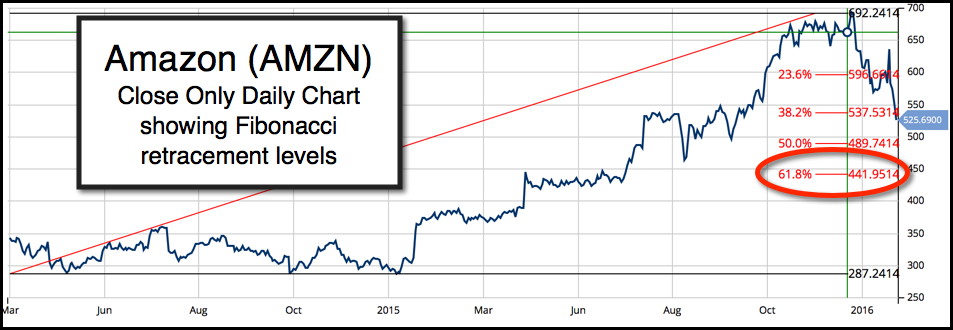
Technically speaking, Amazon could quite easily fall back to the $441.95 level which represents a 61.8% Fibonacci retracement. That is $100 lower than the current price. Personally, I love Amazon, I shop there all the time, but right now I do not like the stock of Amazon. I think that Amazon is setting up to go lower based on the Trade Triangle technology. If my analysis of Amazon is correct, it does not auger well for the rest of the market or the economy. Continue reading "Major Alert: Amazon (NASDAQ:AMZN) Flashes Its First Major Sell Signal In 16 Months"

3 For 3 And 3 More To Watch Today

Good day, MarketClub Members! So, what do I mean when I say 3 for 3?

1: Let's start with Apple, Inc. (NASDAQ:AAPL) - The Trade Triangle technology indicated that the trend was heading lower and Apple was most likely to report disappointing earnings. That is exactly what happened when Apple reported its earnings after the close on 1/26/16. Apple opened lower the next day giving members another winner and profits up to 92% on options trades.

2: Next I recommended that a sidelines position was warranted in Amazon.com, Inc. (NASDAQ:AMZN) as the Trade Triangles were mixed indicating that there was no strong reason to take a position. The trading hours before the close showed Amazon up over 9%. Reality kicked in after the earnings announcement as Amazon gave back all of its earlier gains justifying the sidelines position.

3: Alphabet, Inc. (NASDAQ:GOOG) - Yesterday a weekly Trade Triangle turned green aligning with the monthly Trade Triangle indicating a long position was warranted. Members were rewarded as Google jumped $40 in after-hours trading giving members another winner.

3 stocks to watch today after they release their earnings after the close are: Continue reading "3 For 3 And 3 More To Watch Today"

Can Google Overcome Apple As The Most Valuable Company In The World?

Welcome to the first day of trading in February. If it is anything like January, it's going to be quite a month.

After the close today, Alphabet, Inc. (NASDAQ:GOOG) will announce its earnings. If it is a blowout and Google surges $25, it will then become the most valuable company in the world - not bad for a company that was founded on September 4, 1998 and has only been around for 17 years. It took Apple, Inc. (NASDAQ:AAPL) which was founded April 1, 1976, almost 40 years to become the world’s most valuable company.

Today, Google flashed a buy signal putting both the monthly and weekly Trade Triangles in unison. That indicates there are good odds that Google will beat its earnings estimates after the close. There are no guarantees, but the odds would favor being long Google before the close.

Let's take a look at the rest of the markets which are not having such a good time of it. The dramatic rally on the last day of trading in January was more a function of short covering than anything else. Most stocks and indices are in a longer-term bearish trend based on MarketClub's Trade Triangle technology. Continue reading "Can Google Overcome Apple As The Most Valuable Company In The World?"

Maximizing Seasonal Trading Profits

Sheldon Knight has spent years fine-tuning his methods for pinpointing market direction for stocks and futures. In this video, you will discover how this top technical analyst combines day-of-week and day-of-month price patterns with first notice day effect to produce what he calls "the ultimate seasonal indicator".

You will also learn the money management method that he uses to dramatically improve his profits while reducing his risk at the same time.

WATCH NOW: Maximizing Seasonal Trading Profits

Best,
The INOTV Team

USDJPY: "Diving" For Opportunity

By: Elliott Wave International

On a recent vacation to the Yucatan, my friend decided to get certified in scuba diving.

I, on the other hand, prefer breathing my air above water! But I did tag along with her to one of the classes, anyway. She learned how to handle and interpret all the various diver gauges: gas pressure, submersive pressure, depth, and on.

The one feature all those indicators had in common was a bold, red line to indicate the level the diver must obey to stay out of danger.

That's when it hit me: Scuba-diving is a lot like financial markets. Investors and traders jump in -- and use an array of safety gauges to keep them on the right side of price action.

Well, at least those investors and traders who use technical market indicators. For them, those bold, red lines indicating the point of danger -- those are equivalent to the most critical component of market analysis: protective stops. The second prices cross this line, it's time to "swim back up to the surface" and safely re-adjust your position.

For any investor/trader, then, the ultimate goal is to clearly identify these life-"lines" ahead of time, before jumping in. That, dear friends, is where our newest, FREE report "How to Set and Manage Stops With the Wave Principle" comes in.

Here is an excerpt: Continue reading "USDJPY: "Diving" For Opportunity"