When Two Women Get Into A Fight, It's Never Pretty

This morning, Christine Lagarde, the boss of the International Monetary Fund, announced to the world that the Federal Reserve should hold off raising interest rates until 2016. I do not ever remember the head of the IMF ever saying anything like that before.

So the question begets, is she trying to save her own skin by doing a classic political move and pointing the finger at somebody else, in this case Janet Yellen, head of the Federal Reserve?

My advice on this, it's not going to be pretty and the IMF should take care of its own screw-ups (like Greece) before trying to fix the screw-ups in America.

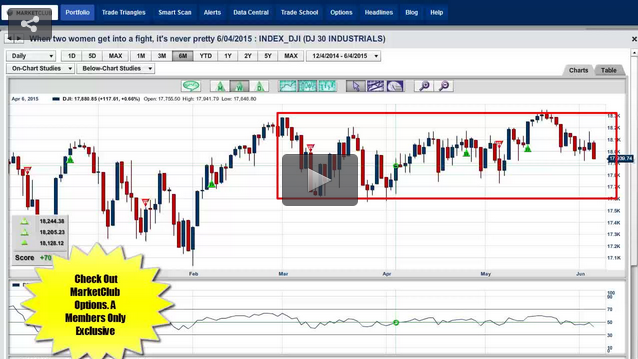
With that said, let's take a look at what's really going on in the marketplace today. I'm going to look at the major indices with the Trade Triangle technology, which by the way is totally nonpartisan and unbiased, and just goes with the flow.

Here's what the Trade Triangle technology is saying right now. Continue reading "When Two Women Get Into A Fight, It's Never Pretty"

Candlestick Patterns – Harami

If you follow our blog, then you are definitely familiar with trader Larry Levin, President of Trading Advantage LLC. We have gotten such a great response from some of his past posts that he has agreed to share one more of his favorite trading tips as a special treat to our viewers. Determining the direction of the market can be tricky and just plain confusing at times, but Larry’s expert opinion keeps it simple.

If you like this article, Larry’s also agreed to give you free access to his award winning book.

I've already covered some of the better known patterns like Doji and Engulfing – now it's time to add Harami to your candlestick chart pattern arsenal. Let's take a look at what this technical signal looks like, and what opportunities might be presenting themselves when you see it.

Harami patterns can be bearish or bullish

Harami, like engulfing patterns, are a two candlestick formation. They are actually often confused with engulfing patterns because they both involve candles where one real body is bigger than the other. The difference is that in harami, the preceding (or first) candle in the pattern is the longer one of the pair; it encompasses the whole body of the second candlestick. Continue reading "Candlestick Patterns – Harami"

The Banks Are Back!

Today, I'm going to be looking at the financial sector to see which of the banking stocks look the strongest.

Here is a list of the five stocks I will be analyzing: Continue reading "The Banks Are Back!"

2 Stocks To Watch This Week

This week, you may want to keep your eye on 2 stocks:

AliBaba Group Holding LTD (NYSE:BABA) and Under Armour (NYSE:UA)

Both of these stocks are in positive trends and have seen a recent pullback from their highs. Is this a good time to buy?

Let's start with the chart of AliBaba and go through the numbers.

Alibaba chart

1. We have a +85 Trend Score as both the weekly and monthly Trade Triangles are positive, indicating a strong upward trend.
2. $120 is the all-time high for this stock and that was shortly after its initial IPO.
3. Major negative force trend line.
4.- 5. Positive divergence on the RSI line versus negative price action.
6. Breakout over the negative force trend line.
7. Trend change with the monthly Trade Triangle at $91.88.

Strategy: Continue reading "2 Stocks To Watch This Week"

Weekly Futures Recap With Mike Seery

We've asked Michael Seery of SEERYFUTURES.COM to give our INO readers a weekly recap of the Futures market. He has been Senior Analyst for close to 15 years and has extensive knowledge of all of the commodity and option markets.

Michael frequently appears on multiple business networks including Bloomberg news, Fox Business, CNBC Worldwide, CNN Business, and Bloomberg TV. He is also a guest on First Business, which is a national and internationally syndicated business show.

Crude Oil Futures

Crude oil futures exploded this Friday afternoon in New York trading higher by $2.60 a barrel currently at 60.26 reversing recent losses as yesterday prices hit a 6 week low and traded down to $56.51 rallying $5 since as there are rumors of facilities being shut down due to the Texas and Oklahoma floods but time will tell to see if that’s actually true. Crude oil futures are now trading above their 20 and 100 day moving average showing high volatility as I’ve been recommending a short position when prices hit a four week low around the $58 level and if you took that trade we are underwater currently so place your stop loss above the 10 day high which remains at 61.75 risking around $1.50 or $750 per mini contract plus slippage and commission from today’s price level. Continue reading "Weekly Futures Recap With Mike Seery"