Capturing Over 100% Premium - Diagonal Spreads

Capturing over 100% of the option's premium income and closing trades prior to expiration is the ideal scenario for options trades. The manner in how one constructs this options trade is the key to these attributes. A diagonal spread leverages a minimal amount of capital, defines risk, and maximizes return on investment while enabling traders to capture greater than 100% of the option premium while accelerating the trade's closure before expiration. Diagonal spreads are ideal when engaging in options trading for many reasons, namely its risk mitigation properties. This type of trade is excellent to layer into a long-term successful overall options strategy which includes risk-defining trades, staggering expiration dates, trading across a wide array of uncorrelated tickers, maximizing the number of trades, appropriate position allocation, and always being an option seller to continuously bring premium income into the portfolio.

Using a combination of diagonal call spreads, diagonal put spreads, call spreads, put spreads, and iron condors over the past 11 months, a total of 248 options trades were placed and closed. During this timeframe, 243 trades were winning trades for a 98% option win rate with an average income per trade of $168, an average return on investment (ROI) per trade of 7.9%, and overall premium capture of 85%. An options-based portfolio can offer the optimal balance between risk and reward while providing a margin of downside and upside protection with high probability win rates. Risk management is essential when engaging in options trading to drive portfolio performance, and diagonal spreads are a key component to this overall strategy (Figures 1, 2, and 3).

Diagonal Spreads

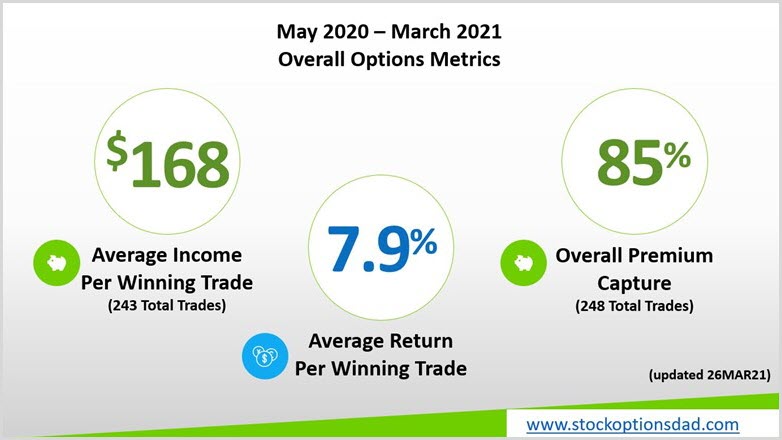
Figure 1 – Comprehensive options-based performance metrics
Continue reading "Capturing Over 100% Premium - Diagonal Spreads"

Futures: All Eyes On This Week's Crop Report

Cotton

Cotton futures in the May contract settled last Friday in New York at 84.68 while ending the week on a positive note up 145 points, breaking a 7-day losing streak currently at 79.89, down nearly 500 points for the week as prices hit a 3 month low.

I have been recommending a bullish position from the 79.00 level, and if you took that trade, continue to place the stop loss below the September 29 low of 66.28 as an exit strategy. This is a high-risk trade as the volatility remains incredibly high as that situation is not going to change anytime soon, especially as we enter the summer season.

Cotton prices are trading below their 20 and 100-day moving average as this recommendation was a counter-trend trade. I believe prices have become too cheap as we topped out on February 25 at 95.68, dropping about 1,800 points in a matter of weeks from today's low. The commodity markets have run into trouble over the last several weeks because U.S. treasuries have hit a 1 year high in yields, pushing the U.S dollar higher, which are two bearish fundamental factors.

I remain bullish across the board. I believe this is just a retracement in a giant secular bullish trend that should continue due to massive quantitative easing from the U.S. government. Traders are keeping a close eye on next week's crop report, which will show the number of acres planted in the United States as that will certainly dictate short-term price action.

TREND: MIXED - LOWER
CHART STRUCTURE: POOR
VOLATILITY: HIGHOW

Coffee

Coffee futures in the May contract is ending the week on a positive note, up 225 points or 1.78% at 128.85 after settling last Friday in New York at 129.00, basically unchanged for the week bouncing off major support around the 125 level as I think prices look very cheap. Continue reading "Futures: All Eyes On This Week's Crop Report"

Weekly Stock Market Forecast

This week we have a stock market forecast for the week of 3/27/21 from our friend Bo Yoder of the Market Forecasting Academy. Be sure to leave a comment and let us know what you think!

The S&P 500 (SPY)

SPY Daily Chart - Stock Market Forecast

Not a lot has changed in my forecast since last week… I believe the S&P 500 (analyzed here using the ETF SPY) is working its way through a possible head and shoulders reversal pattern on the daily chart. This is a very well understood and recognized reversal pattern and would thus attract a lot of profit-taking activity which I’m expecting to turn the market sharply lower.

For those who are more visual, my forecast for the S&P can be best understood by looking at the yellow lines on the attached chart. The bounce I forecasted last week appeared on schedule and is driving the price up for what I believe will be a failed rally ending as a lower high. Continue reading "Weekly Stock Market Forecast"

Stocks Finish Volatile Week On High Note

Stocks soared on Friday, finishing the volatile week on a high note, having their best day in more than two weeks.

The DOW closed 453.40 points higher or +1.4%, to 33,072.88. The S&P 500 rose +1.7% to 3,974.54, hitting a record closing high, and the NASDAQ erased a -0.8% loss to end the session +1.2% higher to 13,138.72. All three indexes rallied to their session highs into the close.

On a weekly level, the DOW and the S&P 500 posted gains for the week, up +1.4% and +1.6%, respectively. The NASDAQ fell -0.6% on the week. However, the market rally has slowed down in recent weeks as rising interest rates and valuation concerns hit big tech stocks. Continue reading "Stocks Finish Volatile Week On High Note"

How To Stop Being Scared

The markets really scared a lot of people in the last month. We’ve received lots of emails and comments from people wondering what’s happening in the markets and why the deeper downtrend didn’t prompt new trade triggers. Well, the quick answer is “this downtrend did prompt new BAN strategy trade triggers and this pullback is still quite mild compared to historical examples.” Allow me to explain my thinking.

The recent FOMC meeting, as well as the expiration of the futures contracts, usually prompts some broad market concerns. Many professional traders refuse to trade over the 7+ days near an FOMC meeting – the volatility levels are usually much higher, and this can throw some trading strategies into chaos. Our BAN Trader Pro strategy handles volatility quite well most of the time.

Recently, the BAN Trader Pro strategy initiated new trade triggers of subscribers and myself. Our members are engaged in the best-performing assets for the potential upside price rally that may take place over the next couple of months. Our strategies target opportunities based on proven quantitative technology – not emotions and use proven position management to maximize gains while reducing drawdowns.

Transportation Index Daily Chart Is Bullish

This leading index shows early strength in the market with an upside target of $14,668. That is a 3.5%-4.5% upside move ahead of us.

Recently, we’ve seen some substantial support in the Transportation Index that aligns with our BAN Trader Pro strategy. The rally in the Transportation Index, which usually leads the US economy by at least 2 to 4 months, suggests the markets are actively seeking out a support level/momentum base for another rally phase. Continue reading "How To Stop Being Scared"