The Year The World Fell Down The Rabbit Hole

Conspiracies and bias hurt investors. It’s no wonder so many people have been unable to attain proper market positioning in 2020. You invest with your heart, soul, fears, or even sometimes your intellect and you risk blowing yourself up at worst, or missing out at best. For much of 2020 Twitter has been a forum for ‘influencers’ with tens of thousands of followers spewing dogma and influencing their herds alright. I watched it happen all year, in the Twitter machine and at other venues.

You know the perma-bearish or ‘got gold?’ types, issuing dire warnings and authoritative discussion of just how bad off the world is (well, it ain’t good, I grant them that). But it’s the practical reaction or lack thereof, not the news itself that matters.

So Warren Buffett bought a gold stock. The gold “community” immediately seized upon it as validation and an opportunity to lecture the herds. What it actually was though, was a top prior to a healthy and much-needed correction (handily, right from our long-standing target of HUI 375).

Buffett Buys a Gold Stock! Continue reading "The Year The World Fell Down The Rabbit Hole"

World Oil Supply And Price Outlook, December 2020

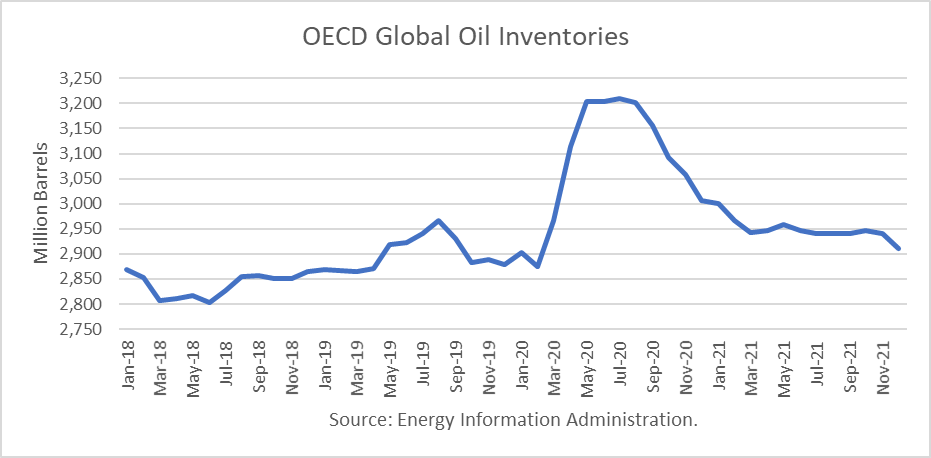
The Energy Information Administration released its Short-Term Energy Outlook for December, and it shows that OECD oil inventories likely bottomed in this cycle in June 2018 at 2.804 billion barrels. Stocks peaked at 3.210 billion in July 2020. In November 2020, it estimated stocks dropped by 34 million barrels to end at 3.057 billion, 169 million barrels higher than a year ago.

The EIA estimated global oil production at 93.45 million barrels per day (mmbd) for November, compared to global oil consumption of 95.59 mmbd. That implies an undersupply of 2.14 mmbd or 64 million barrels for the month. About 30 million barrels of the draw for November is attributable to non-OECD stocks.

For 2020, OECD inventories are now projected to build by net 127 million barrels to 3.006 billion. For 2021 it forecasts that stocks will draw by 95 million barrels to end the year at 2.910 billion.

Oil

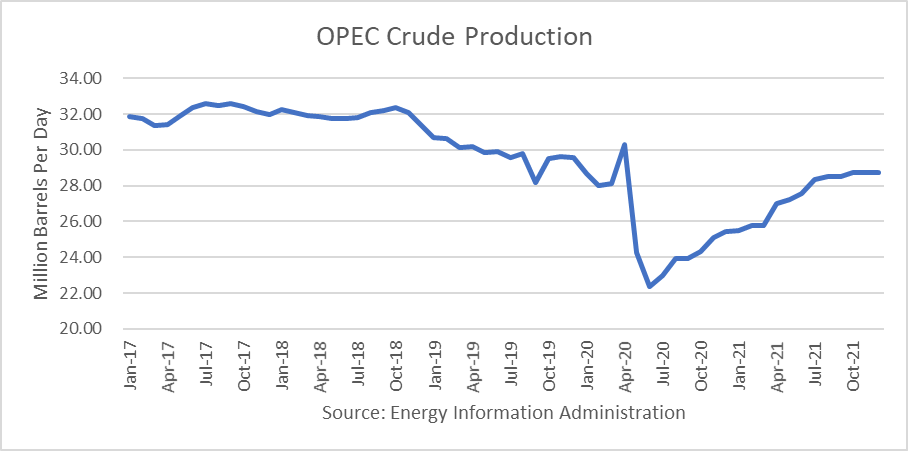
The EIA forecast was made incorporates the OPEC+ decision to cut production and exports. According to OPEC’s press release:

Adjust their overall crude oil production downwards by 9.7 mb/d, starting on May 1st, 2020, for an initial period of two months that concludes on June 30th, 2020. For the subsequent period of 6 months, from July 1st, 2020 to December 31st, 2020, the total adjustment agreed will be 7.7 mb/d. It will be followed by a 5.8 mb/d adjustment for a period of 16 months, from January 1st, 2021, to April 30th, 2022. The baseline for the calculation of the adjustments is the oil production of October 2018, except for the Kingdom of Saudi Arabia and The Russian Federation, both with the same baseline level of 11.0 mb/d. The agreement will be valid until April 30th, 2022. However, the extension of this agreement will be reviewed during December 2021.”

Oil

Oil Price Implications

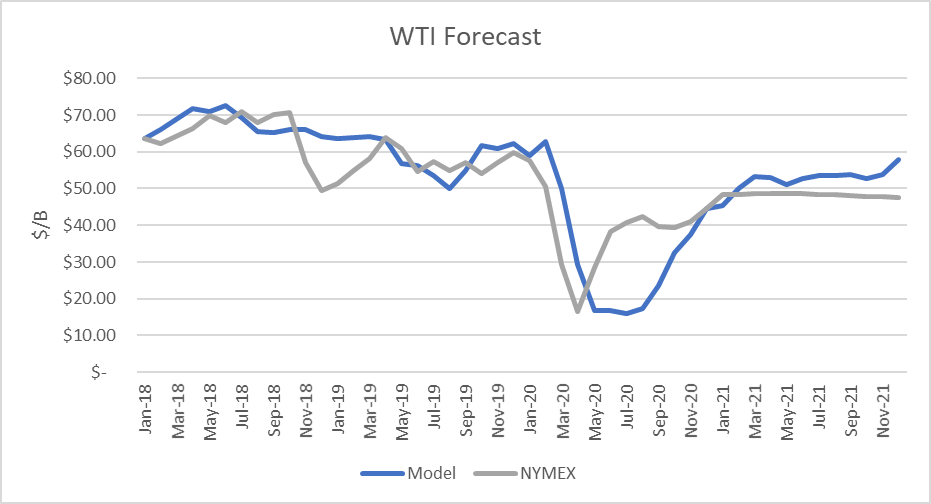
I updated my linear regression between OECD oil inventories and WTI crude oil prices for the period 2010 through 2019. As expected, there are periods where the price deviates greatly from the regression model. But overall, the model provides a reasonably high r-square result of 79 percent.

Oil

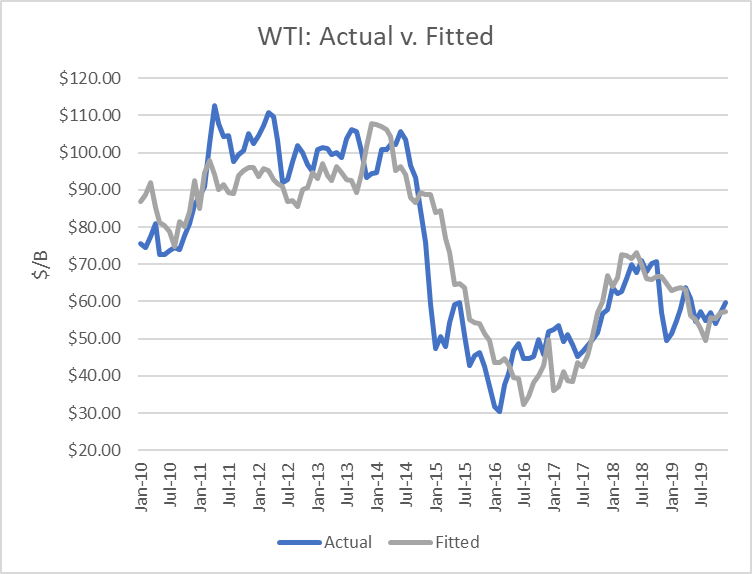
I used the model to assess WTI oil prices for the EIA forecast period through 2020 and 2021 and compared the regression equation forecast to actual NYMEX futures prices as of December 31st. The result is that oil futures prices are presently undervalued through the forecast horizon in 2021.

Oil

Uncertainties

April 2020 proved that oil prices can move dramatically based on market expectations and that they can drop far below the model’s valuations, whereas prices in May through December proved that the market factors in future expectations beyond current inventory levels.

The most important uncertainty is how deeply and how long the coronavirus will disrupt the U.S. and world economies. The announcements of vaccines and economic assistance lends credibility that a recovery is in store for 2021.

But what kind of recovery will it be? How much of business and daily life will be altered for the longer-term? Online meetings instead of face-to-face meetings, work-from-home, and other such changes may alter petroleum demand patterns long-term.

Conclusions

Equally, on the supply side, the transition away from fossil fuels has taken a big leap forward in 2020, with the major oil companies announcing investment shifts. The petroleum era is coming to a close, at least in terms of sustained growth.

Check back to see my next post!

Best,
Robert Boslego
INO.com Contributor - Energies

Disclosure: This contributor does not own any stocks mentioned in this article. This article is the opinion of the contributor themselves. The above is a matter of opinion provided for general information purposes only and is not intended as investment advice. This contributor is not receiving compensation (other than from INO.com) for their opinion.

8 Months, 186 Trades and 98% Options Win Rate

At the core of options trading is defining risk, leveraging a minimal amount of capital, and maximizing return on capital. Options enable smooth and consistent portfolio appreciation without guessing which way the market will move. Options allow one to generate consistent monthly income in a high probability manner in both bear and bull market scenarios. Over the past 8-plus months (May-December), 186 trades were placed and closed. A win rate of 98% was achieved with an average ROI per winning trade of 7.7% and an overall option premium capture of 82% while matching returns of the broader market and outperforming during market downswings. An options-based portfolio's performance demonstrates the durability and resiliency of options trading to drive portfolio results with substantially less risk. The risk mitigation element is particularly important, considering markets are richly valued as measured by any historical metric (Figures 1 and 2).

Options

Figure 1 – Overall option metrics from May 2020 – December 31st, 2020
Continue reading "8 Months, 186 Trades and 98% Options Win Rate"

Has Bitcoin Reached Its Peak?

We hope you enjoyed the brief holiday break… it seems Bitcoin has been busy while the markets have been resting! Bitcoin enthusiasts are adamant that the price rally has just started a parabolic move higher. From a technical standpoint, this current rally certainly appears to have gone parabolic. As any trader already understands, what goes up may eventually come crashing downward.

My research team and I believe failure at the current highs would represent a clear technical divergence pattern between price and the RSI indicator. Additionally, the current rally that started on December 20 consists of a $10,850 rally phase. The previous rally from October 20 to December 2 consisted of a $9,200 rally phase. We believe this current rally phase from December 11 could be a Wave 5 rally (almost equal to the Wave 3 rally range). If our researchers are correct, this final rally phase could come crashing downward after reaching these peak levels above $28,000.

This 4 Hour Bitcoin chart highlights the incredible price rally that has taken place over the past 16+ days – a rally of over $10,000. It also highlights two very clear price rally phases – creating an A-B-C price wave pattern.

Bitcoin

This Daily Bitcoin chart highlights the two, almost identical in size, which has created a price peak above $28,000. It also highlights the technical divergence between price and the RSI indicator in the lower pane. Continue reading "Has Bitcoin Reached Its Peak?"