Bank of Japan To Release More Stimulus?

Lior Alkalay - INO.com Contributor - Forex


Yep, it's the same old story; once again, Japan is just muddling through. Private consumption is weak and inflation is practically non-existent. And inflation could get worse with the latest plunge in oil prices. And with Japan barely slogging through, investors' call for the BoJ to amp its efforts are on the rise.

So what's the problem? In the eyes of the BoJ, the situation isn't really bad enough to require further intervention.

What The BoJ Sees

So why wouldn't the BoJ want to add any more gunpowder to an already aggressive stimulus plan? The answer comes in two parts.

The first part was covered extensively in my last article and thus needs little elaboration. That is the BoJ wants the Abe government to shoulder some of the burden. It needs to fulfill its own side of the bargain and push forward much needed financial reforms.

And the second part? The BoJ wants to hold some gunpowder in its arsenal... just in case things get worse. With the Chinese stock market meltdown radiating across the world, the BoJ wants to make sure it has enough "weapons" to unleash. But so far, in the eyes of the BoJ, it's not yet bad enough to risk the economy.

Graph of Japanese Annual Inflation
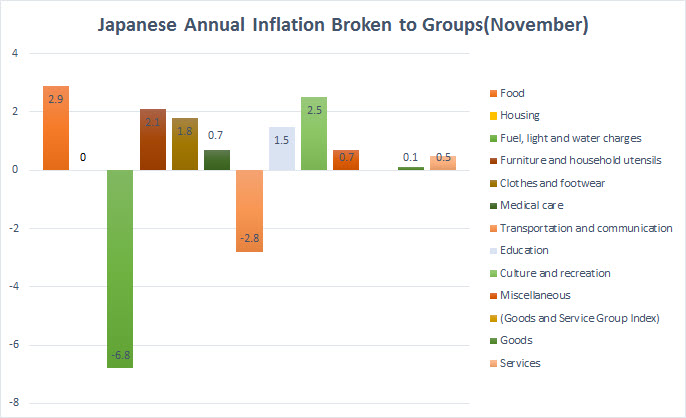
Chart courtesy of The Statistic Bureau of Japan

Let's take a quick look at the latest key data. November's inflation figure (annualized), albeit rather low, still wasn't the textbook definition of deflationary pressures. From a total of 10 various segments, from food to energy to housing, only transportation and energy fell on an annual basis while Housing prices were unchanged at 0%. Despite the dismal numbers, for deflation to be a risk, prices of most items need to fall. And as the chart below shows, that has yet to happen. Continue reading "Bank of Japan To Release More Stimulus?"

How To Trade Apple's Earnings Today

After the close of business today Apple, Inc. (NASDAQ:AAPL) will report its fourth quarter earnings. I thought it would be interesting to go back and look at the last three years to see how you would have done if you just used this simple trade strategy.

The premise is simple, when both the weekly and monthly Trade Triangles are in sync, i.e. when they are both in the same direction, you would take a position on the close in the direction the Trade Triangles were indicating. You would then exit this position the following day on the close.

So here's what is needed to make a trade in Apple before today's earnings report is released. The position is taken the day Apple, Inc. (NASDAQ:AAPL) releases its earnings report, i.e. today.

(1) Both the weekly and monthly Trade Triangles are in sync.

(2) Take a position on the close in the direction the Trade Triangles are indicating.

(3) Exit the position the following day on the close.

These are simple, straightforward instructions. As an old mentor of mine used to say, "They don't pay you any more for making it complicated."

So how has this worked in the past? Continue reading "How To Trade Apple's Earnings Today"

An Unlikely Hero For Your Portfolio

Daniel Cross - INO.com Contributor - Equities


The markets have been anything but predictable just a few weeks into 2016 and investors are wondering if we're on the verge of a major bearish reversal or it's a temporary correction. Oil seems to go lower and lower despite with no sign of stopping anytime soon while the economy is still reeling from the loss of Chinese demand and the impact of the first Federal Reserve rate hike. For investors, there's no better time to start getting defensive.

When uncertainty reigns in financial markets, certain sectors become safe havens. Companies that offer products that are used regardless of the state of the economy like healthcare and consumer staples tend to outperform during these times. These types of stocks generally carry a dividend yield as well which helps protect investors from downside movements.

The consumer staples sector is particularly attractive in the very beginning of a possible bear market because it's historically provided relatively high returns with low volatility. While most investors think of this sector as “boring” filled with plain vanilla stocks and companies, it's actually one of the highest returning sectors in the market regardless of economic direction.

Annualized returns by sector from 1962 to 2015 revealed that consumer staples generated gains of 12.9% – trailing just slightly behind healthcare. From a volatility standpoint, consumer staples had the second lowest with utilities being the least volatile. Continue reading "An Unlikely Hero For Your Portfolio"

Anatomy Of The Gold Market

Well it was quite a weekend here on the East Coast with a record-breaking blizzard that closed down Washington DC today and made digging out from the 30-some inches of snow quite an interesting challenge. For those of you who live on the East Coast like us, we hope that you and your loved ones were all safe over this dangerous storm.

Now let's take a look at the gold market. This market has been in a bear market for the last four years, almost the exact opposite of the equity markets that have been going up for the last six years. It appears technically that gold is once again coming into style as more investors are becoming leery of the equity markets and the value of their holdings and money in general.

A great deal of this uncertainty has been created by the Federal Reserve Board and the European Central Bank which seemed to have run out of ideas and tools. It appears to this observer that in the last few years these two central banks have literally been winging it on a hope and a prayer. I hope I am wrong on the one as it will make 2008 look like a walk in the park.

8 year daily chart of gold

CHART 1

Looking at the long-term chart of gold, you see a MAJOR LONG-TERM SUPPORT TREND LINE that supported gold for several years before it was broken (see figure 1 on the chart). After breaking below the support line, the gold market again tried to rally, but failed (you can see this in figure 2), which created a TWIN MOUNTAIN TOP. Once through (figure 3) the PIVOT POINT, it was all over for gold as it moved into a major bear market that has now lasted just over four years.

The big question is … has the bear market in gold come to an end? Continue reading "Anatomy Of The Gold Market"

An Aggressive Covered Call Options Strategy For Netflix

Netflix is a high-flying growth stock with a sky-high valuation based on its price-to-earnings multiple. Due to its rapid growth, expanding original programming, wrestling market share away from big cable companies, expansion into international markets and its overall ubiquity, it’s difficult to arrive at an accurate valuation based on traditional metrics. Due to these factors and the difficulty of placing an accurate valuation on Netflix, options in the form of aggressive covered call writing may be an effective way to leverage this high-flier while mitigating downside risk and generating additional income. Netflix offers a confluence of volatility, liquidity and a high level of interest which gives rise to high yielding premiums on a bi-weekly or monthly basis which bodes well for options trading. Selling aggressive covered call options (i.e. aligning the strike price at or near the current price) to generate current income may augment overall portfolio returns while mitigating risk. This may be particularly invaluable if one is long a highly volatile stock such as Netflix. Below, I’ll walk traders through an aggressive options trading strategy leveraging Netflix stock a proxy. Continue reading "An Aggressive Covered Call Options Strategy For Netflix"