It's A Leap Year So Watch Out!

In Ireland, February 29 is Bachelor's Day - a traditional holiday when women propose to men. Scotland began the tradition in 1288 by passing a law permitting women to propose and if refused, the man had to pay a fine. Only in Europe.

Leap years are also election years, as every politician knows, four years is just enough time for the electorate to forget all their broken promises from last time around. Plus, we all must take a giant leap of faith when you go to the polls.

Okay, back to the markets. It is hard to believe that we are rapidly coming to the end of the second full trading month of 2016. The first two months have been extraordinarily volatile with triple digit swings becoming the norm. As we move into March, I expect to see the markets begin to settle down somewhat.

So what's trending so far in 2016? Continue reading "It's A Leap Year So Watch Out!"

Sometimes No Position Is The Best Position

What do I mean by that?

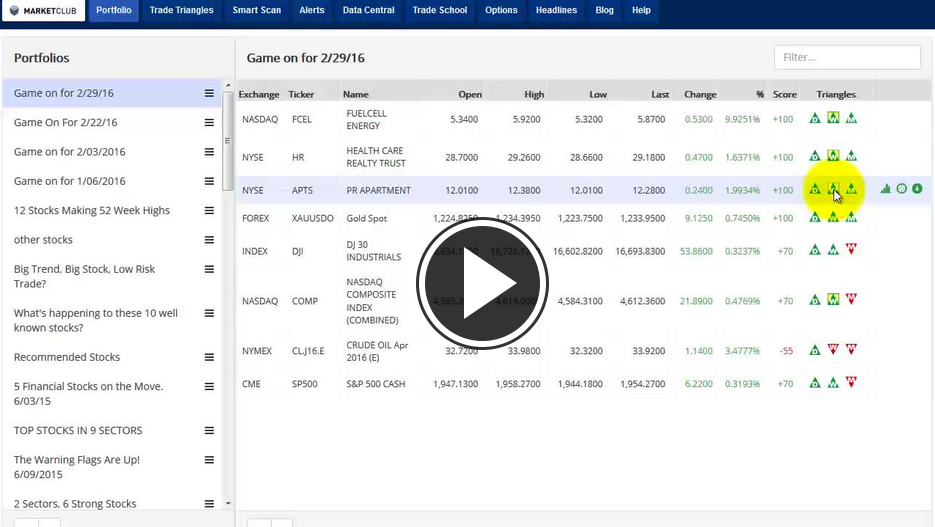
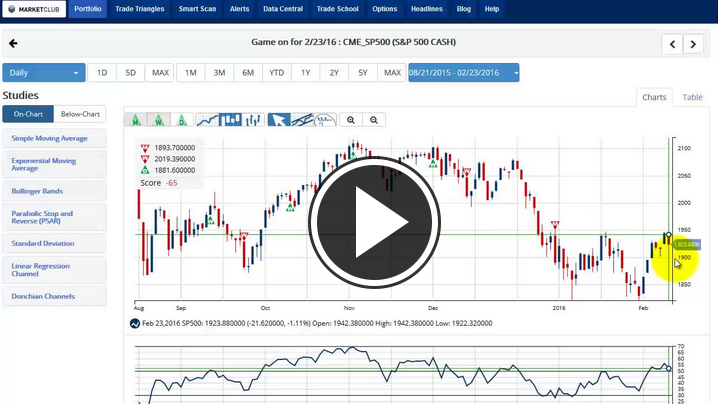
To put it simply, sometimes being on the sidelines in a cash position can be beneficial to your portfolio. There are times in the market when trends are very clear, whether it be up or down. At the moment when you look at the DOW Index, the Trade Triangle technology is indicating that you should be on the sidelines as the major trend remains down while the intermediate-term trend is positive. Over at the NASDAQ and the S&P 500, you should still be negative on those indices, providing the 4,636.93 and 1947.20 levels are not breached to the upside.

Today could be a very interesting day, we could see the recent upward momentum reverse back down and witness a pullback in the major indices and many stocks that have recently rallied against their longer-term negative trends.

Here are a few of the stocks I'm covering today. Continue reading "Sometimes No Position Is The Best Position"

Alphabet, Amazon and Apple All Have Something In Common

Hello MarketClub members everywhere. Well, here we are at the end of one extraordinary week for the equity markets. I don’t remember a week where we watched the major market indices rally so dramatically from a bearish position in just three days.

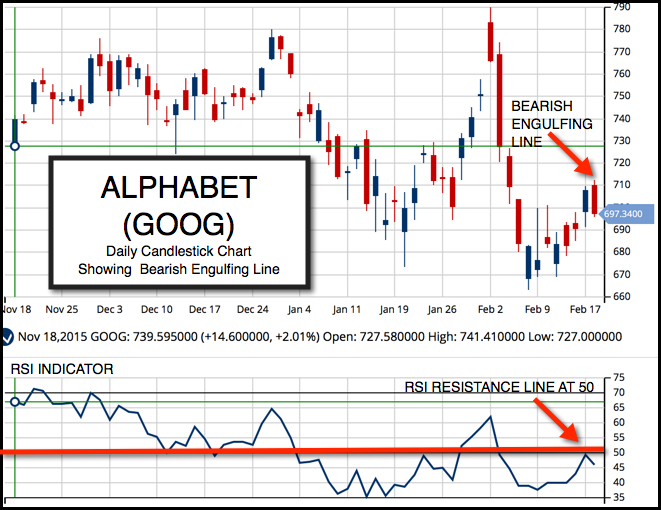
In today's post, I'm going to be looking at the big 3 A's, Alphabet, Amazon and Apple. What these three stocks have in common is that they are all in downtrends and they all formed a negative (bearish) engulfing line yesterday. Should any of these three stocks close lower today, they will confirm that the high on Thursday will be a formidable resistance area for these stocks to overcome in the future.

Alphabet Inc.(NASDAQ:GOOG)

Trade Triangles: Weekly red, Monthly red, overall trend is bearish, trend strength -85.

Daily Chart of Alphabet Inc.(NASDAQ:GOOG)

Alphabet has a negative trend at the moment even though it has been extraordinarily strong in the past several years. It's not to say that it's going to hell in a hand basket, but rather it will begin to reflect a slowing economy that is evident in both the retail and dining sector. I would view a close below $697.34 as a confirming signal that it has put in an interim top and is going to retest its recent lows. Continue reading "Alphabet, Amazon and Apple All Have Something In Common"

This Indicator Is A Winner For Long-Term Traders

It has been one heck of a week to say the very least and it is not over yet. I want to take a look at a tool that I'm pretty confident in saying that very few traders ever watch. The tool I'm discussing is MarketClub's quarterly charts. If you have not seen this MarketClub feature, you may want to check it out, particularly if you are a long-term trader.

I'm going to be looking at the S&P 500 to see just how close the quarterly chart is to turning negative. I'm also going to be looking at a textbook example of a downside measurement on the S&P 500.

I will also be analyzing Apple and Yahoo, both of which could be in for a pretty bumpy ride.

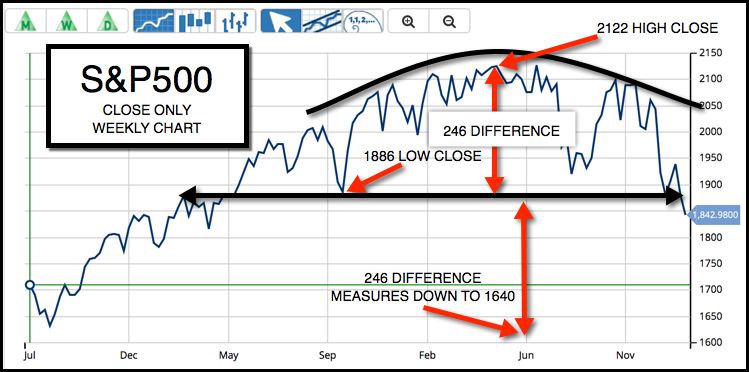
Let's begin by looking at the S&P 500 (CME:SP500) and the textbook example I mentioned earlier for measuring a down move. I'm using a close-only weekly chart and you will see exactly how I measure the move.

Weekly Chart of S&P 500 (CME:SP500)

Next let's take a look at this long-term quarterly chart of the S&P 500 and as you can see it is poised to possibly break the positive long-term trend that has been in place since October of 2010. Continue reading "This Indicator Is A Winner For Long-Term Traders"

Here's How We're Attacking AMZN And AAPL In This Volatility

Markets are getting crushed in here and tech continues to lead us lower. Join me on the trade desk as I take you into our option positions in Apple and Amazon and with Fibonacci analysis, we analyze just how low these tech giants can fall.

Learn more about TradingAnalysis.com here.

Plan Your Trade, and Trade Your Plan,
Todd Gordon