Has Gold Suddenly Lost Its Glitter?

Hello MarketClub members everywhere! Here we are starting a new trading week and the big news is a sharp rally in equities and a big pullback in gold. The question on everyone's mind is, "is this for real or just a rally in a bear market in equities and a pullback in the bull market for gold?"

Gold

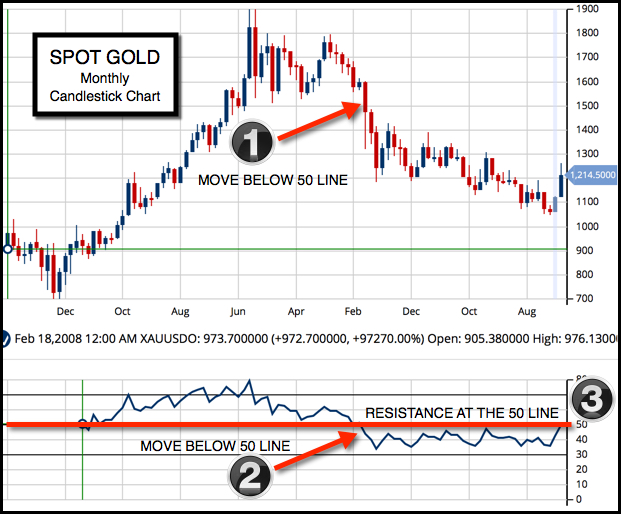
Let's take a look at gold, first of all. I believe that the gold (FOREX:XAUUSDO) market has finally come to life again after hitting a peak in August 2011 and then losing the half its value over a period of four years.

Looking at a long-term chart of monthly gold prices you can see that (2) was the first time that gold had moved below the RSI 50 line. This long-term indicator was showing you that gold prices were in serious trouble. It is also worth noting that the RSI indicator (3) has stopped every rally in gold. I expect to see more consolidation in this market and then see gold break over its resistance at the RSI 50 level. When that happens, expect to see a potential multiyear bull market to take place in gold.

Monthly Chart of Gold

Continue reading "Has Gold Suddenly Lost Its Glitter?"

This Indicator Is A Winner For Long-Term Traders

It has been one heck of a week to say the very least and it is not over yet. I want to take a look at a tool that I'm pretty confident in saying that very few traders ever watch. The tool I'm discussing is MarketClub's quarterly charts. If you have not seen this MarketClub feature, you may want to check it out, particularly if you are a long-term trader.

I'm going to be looking at the S&P 500 to see just how close the quarterly chart is to turning negative. I'm also going to be looking at a textbook example of a downside measurement on the S&P 500.

I will also be analyzing Apple and Yahoo, both of which could be in for a pretty bumpy ride.

Let's begin by looking at the S&P 500 (CME:SP500) and the textbook example I mentioned earlier for measuring a down move. I'm using a close-only weekly chart and you will see exactly how I measure the move.

Weekly Chart of S&P 500 (CME:SP500)

Next let's take a look at this long-term quarterly chart of the S&P 500 and as you can see it is poised to possibly break the positive long-term trend that has been in place since October of 2010. Continue reading "This Indicator Is A Winner For Long-Term Traders"

This High-End Retailer Is Beating The Odds

Daniel Cross - INO.com Contributor - Equities


If you've payed any attention to the markets so far this year, it comes as no surprise that we're teetering on the edge of a major bearish reversal after many years in a bull market. The broader indexes are all down for the year and volatility is on the rise. With all the negative action going on right now, a stock that's on its way up stands out.

Stocks that outperform when the major averages are under performing deserve a closer examination. In order to appreciate amidst the storm of bearish momentum, these companies are generally doing something very right.

One company is undergoing a radical transformation and it's stock price is already beginning to show it. Despite all the negative macroeconomic news, this high-end retailer is belting out upside earnings surprises and growing sales both domestically and internationally – including China. Continue reading "This High-End Retailer Is Beating The Odds"

Major Alert: Amazon (NASDAQ:AMZN) Flashes Its First Major Sell Signal In 16 Months

In the first 30 minutes of trading today, Amazon.com Inc. (NASDAQ:AMZN) triggered a red monthly Trade Triangle indicating a major trend change in this stock. This could be partly due to Amazon's announcement yesterday that it planned on opening 400 brick and mortar bookstores. So after putting almost every bookseller out of business, Amazon is now going into the brick and mortar business. Could that be a big mistake for Amazon?

Daily Chart of Amazon.com Inc. (NASDAQ:AMZN)

Technically speaking, Amazon could quite easily fall back to the $441.95 level which represents a 61.8% Fibonacci retracement. That is $100 lower than the current price. Personally, I love Amazon, I shop there all the time, but right now I do not like the stock of Amazon. I think that Amazon is setting up to go lower based on the Trade Triangle technology. If my analysis of Amazon is correct, it does not auger well for the rest of the market or the economy. Continue reading "Major Alert: Amazon (NASDAQ:AMZN) Flashes Its First Major Sell Signal In 16 Months"

Can Google Overcome Apple As The Most Valuable Company In The World?

Welcome to the first day of trading in February. If it is anything like January, it's going to be quite a month.

After the close today, Alphabet, Inc. (NASDAQ:GOOG) will announce its earnings. If it is a blowout and Google surges $25, it will then become the most valuable company in the world - not bad for a company that was founded on September 4, 1998 and has only been around for 17 years. It took Apple, Inc. (NASDAQ:AAPL) which was founded April 1, 1976, almost 40 years to become the world’s most valuable company.

Today, Google flashed a buy signal putting both the monthly and weekly Trade Triangles in unison. That indicates there are good odds that Google will beat its earnings estimates after the close. There are no guarantees, but the odds would favor being long Google before the close.

Let's take a look at the rest of the markets which are not having such a good time of it. The dramatic rally on the last day of trading in January was more a function of short covering than anything else. Most stocks and indices are in a longer-term bearish trend based on MarketClub's Trade Triangle technology. Continue reading "Can Google Overcome Apple As The Most Valuable Company In The World?"