Silver Has Three Options To Go

Last week I showed you the chart where gold and silver were compared. The latter was in a worrisome lag behind the shining gold. I think most of us got tired to see if the white metal could update at least the top, that was hit last September amid gold striking one target after another reaching a 7-year maximum. Then I asked you to share your opinion as this alarming signal could be a double-edged sword. Below are your bets about it.

Silver

The majority picked the optimistic option of gold, leading the silver to the upside. The opposite came true last week as silver plummeted deep with a minus 14% off the week’s top dragging gold down; the latter lost almost an 8% off the weekly maximum. But before that, gold managed to reach target #4 at the start of last week!

What’s next for silver? Continue reading "Silver Has Three Options To Go"

My Big Trend Analysis For Silver Investors - Part 2

This, the second part of our Silver research article suggesting Silver may be forming a massive price base in preparation for an explosive upside move, will continue from Part I of this research series.

Our research team believes Silver is setting up in a price pattern that may already be “ripe” for an explosive upside move. Our researchers have poured over the data and believe the disparity between Gold and Silver is already at excessive levels.

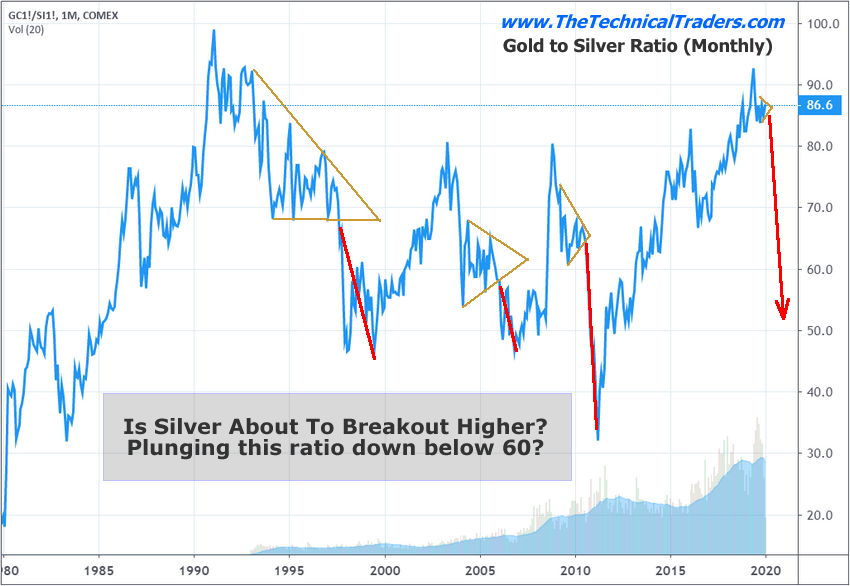
Historically, anytime the disparity between Gold prices and Silver prices (rationalized into comparative Gold price levels) breaches 30% to 60% and Gold begins an upside price advance, Silver typically begins to move higher with 4 to 8+ months. This setup pushes the Gold to Silver ratio back below 50 or 60 as Silver rallies substantially higher, and faster than the price of Gold.

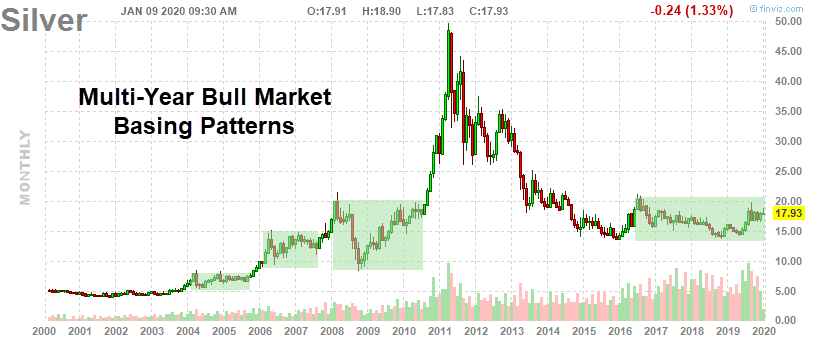
Comparatively, Silver continues to trade within a sideways price range after basing in early 2016. This price range has been fairly consistent between $14.50 and $21.0. With Gold recently starting to move higher because of the US/Iran military conflict, this raises an early warning flag for our research team because Silver has continued to trade below $18 – and well below recent highs near $20.

The price disparity between Gold and Silver is currently greater than 200% based on our proprietary modeling system. Remember, anytime this disparity level is greater than 30% to 60% and Gold breaks out in a rally, Silver will break to the upside within just a few months.

Silver Gold

The second stage rally in Silver, the real money-maker, will come when investors pile into Silver and Silver Miners as the breakout in Silver becomes explosive. The time to get into this trade is/was now or 4 months ago. Still, there is plenty of opportunity for skilled traders right now because the breakout move in Silver and Silver Miners has not really begun yet. Continue reading "My Big Trend Analysis For Silver Investors - Part 2"

My Big Trend Analysis For Silver Investors - Part 1

Everyone seems to be focused on Gold recently and seems to be ignoring the real upside potential in Silver. With all the global economic issues, military tensions, geopolitical issues, and other items continually pushed into the news cycles, it is easy to understand why traders and investors may be ignoring Silver.

Silver has really not started to move like the other precious metals. Gold is up over 45% since 2016. Palladium is up over 350% since 2016. Silver is up only 29% since 2016. The Gold to Silver ratio is currently at 86.7 – very near to the highest level on record going back over 25 years.

Silver

Historically, Silver rallies 6 to 12+ months after Gold begins a price rally. The big break in the Gold to Silver ratio comes at a time when Gold rallies by more than 30% to 60% faster than the price of Silver. In other words, when a major disparity sets up in the price of Gold compared to the price of Silver, then Silver explodes higher – which results in a drop in the Gold to Silver ratio. Continue reading "My Big Trend Analysis For Silver Investors - Part 1"

Gold & Silver Stocks Belie COT Caution

We all know that the gold and silver Commitments of Traders are very extended and at levels of commercial net shorts and large spec net longs that tend to be in place at tops in the metals. Well, the metals topped in the summer, so what does that tell us?

For one thing, it tells us that bull market rules are different from bear market rules as per this post from August as gold was topping.

Gold and Silver Commitments of Traders for This Week

Listen sports fans, I just call ’em as I see ’em. The Commitments of Traders for gold is as extended as it has been lately and open interest is significant. Speculators are all-in here and while we note that bull market rules are different than bear market rules, extended is extended. Gold is vulnerable to pullback by this measure, especially since the gold price is in the target zone we laid out months ago.

Gold dropped about 100 bucks an ounce from the time of that post and yet the CoT are not cured. Talk about bull market rules! CoT was and is a reason for a level of caution, but as noted last weekend in NFTRH 579 the charts of several miners we track (and I own) belied a cautious stance.

From #579…

The way things appear to be setting up is that the miners are preparing to be a ‘go to’ play when the stock market party burns out. Despite the caution begged by the gold and silver Commitments of Traders, the chart of HUI, the Gold/SPX ratio on page 30 and the fact that Friday was a holiday shortened affair, the overall look of our charts this week is constructive to bullish

HUI has gone on to have a thus far bullish week this week with a move to break the post-summer consolidation and as we’ve noted in NFTRH, the HUI/Gold ratio has remained intact and is also now in a bullish stance. It’s a leader, as is the Silver ETF vs. silver. Get a load of this. Continue reading "Gold & Silver Stocks Belie COT Caution"

Macro Implications, As Silver Takes Leadership From Gold

Since we noted the initial move to break the 200 day moving average – and at least temporarily break the downtrend on August 27th – the Silver/Gold ratio (SLV/GLD) has held its breakout, looking to close the week and the month of August on a signal that we have long anticipated.

silver gold ratio

Okay, but the monthly chart of the Silver/Gold ratio makes abundantly clear that nothing has happened that has not happened before during the precious metals bear market. So that is the caveat to a macro thesis that would see a change to inflationary (as led by Silver/Gold), thereby letting commodities of all stripes and many global markets out of the barn. The monthly EMA 30 (grey dotted line) is a reasonable marker for the ratio’s post-2011 containment. The ratio’s price is below that marker. Continue reading "Macro Implications, As Silver Takes Leadership From Gold"