Pre-Fed Precious Metals Update

We review these metals as the media schleps all over itself trying to tell people why the Fed will cut 1/4, will cut 1/2, should not cut at all and/or why the president of these United States of America is on Twitter haranguing the Fed to be as disreputable as Mario Draghi and China’s central planners because they know how to play the game. It’s all a game after all, isn’t it Trump? You old currency warrior, you.

Copper daily is nesting on the SMA 50 but locked below resistance and the SMA 200. Still in bounce mode but very unspectacular.

copper

Copper weekly still looks pretty gross. It’s above critical support but locked below a ton of resistance. The 2016-2019 pattern also looks like a freak. I refuse to like industrial metals (or cyclical commodities in general) until I get some technical reason to like them. Continue reading "Pre-Fed Precious Metals Update"

Very Long-Term Silver

Just for fun because I am a chart guy who all too often bores you (and me) to death with ratio and indicator charts and all too seldom makes charts just for the fun of it anymore…

So this long-term silver chart is just for the fun of it. What do we have here?

  • A very long-term Cup & Handle; and boy what a handle. It killed the true believers years ago. I like that the 2011 (bubble) right side high is higher than the 1980 (bubble) left side high (monthly closing basis).
  • A price that has held a very long-term support level at 14, coinciding with a 79% Fib retrace (if you believe Fibs are relevant).
  • Vertical cycle lines spaced around 8 years apart that have marked the two bubble highs, a minor high in the late 80s that led to a years-long trough, a whole lot of nothing in the mid-90s and the start of a massive bull market in 2003. The current line would appear to be a marker to a low.
  • Yes, that thing from 2006 to today looks like an ugly Head & Shoulders pattern, so let’s give it its due as well. If I am wrong about an inflationary near future – and the Gold/Silver ratio still stands in defiance of an inflation trade on this day – you’d want to at least be aware of the bear’s potential.
  • Another thing I don’t care for is the decade long trough that sprung the 2003 bull market vs. the much shorter flat period leading to today. Silver has certainly not had that level of desolation to its investment landscape since the most recent bubble popped in 2011.

So okay, there are at least two caution points if you want to take the long-term chart seriously.

That said, nothing’s changed. I am bullish on silver at this time and prepared to get more bullish if/when it takes over for gold. But obviously, that very important support around 14 that silver twice tested in the last year and three times tested in the last 5 needs to hold. Continue reading "Very Long-Term Silver"

Gold Bullhorns Quieted For A Day, At Least

Over in the gold patch, things went from disinterested and downright antagonistic (A Notable Lack of Interest in Gold) to sleepy (Gold “Community” Crickets) to ferociously over bullish.

Any long-time and right-minded gold bug will tell you that the latter condition is usually a signal to prepare for some turbulence. Wednesday and Thursday brought the turbulence in the form of a reversal and pullback for gold, silver and the miners.

Since we became constructive on the gold sector in Q4 2018 (per the links above and especially NFTRH reports/updates) the groundswell of gold boosting (pom poms and all) has steadily risen since it became obvious that something bullish was going on in January. And it appears that last week’s breakout from various daily chart bull flags in gold, silver and the miners finally jerked ’em all in. Enter the Thursday pullback.

In the very few days immediately before that $20/oz. pullback the gold “community” threw itself a gathering of the bullish clans. On just a quick look around the gold websites, some quotes popped out from 2 days before the pullback and one day before Wednesday’s reversal. It’s crickets no more… Continue reading "Gold Bullhorns Quieted For A Day, At Least"

A Precious Metals Update

I reserve most of the work on precious metals for NFTRH weekly reports and in-week updates because it is done on a consistent basis, with the work done previously key to the narrative making sense in real time and going forward. In other words, in order to not be out there stabbing in the dark, you need to have an ongoing, adjustable plan that makes sense at all times with the macro markets around it.

So that said, let’s take a snapshot of where things stand currently with the understanding that this work will need future updates, which will probably not be made publicly. It is up to the reader to do the work required to put context to the picture. Meanwhile, this will free up more space in next week’s NFTRH 538 to focus on some quality miner charts, which sometimes take a back seat to the macro/sector stuff.

Precious Metals Update

First off, Commitments of Traders data are only available through 12.31.18 as a result of the government shutdown. So we are flying somewhat blind from that perspective. At the end of December, the CoT for gold and silver were well on their way to a bearish alignment. Have they maxed their trends and reversed in the meantime? It is quite possible, especially since the metals have taken pullbacks (within their intermediate uptrends) recently.

We have been following an analog to 2001, which saw SPX break down below its 50 & 200 day moving averages as HUI began its bull market. What’s more, SPX then tested its breakdown in Q1 2001… Continue reading "A Precious Metals Update"

Gold Extends Consolidation Giving Silver Another Chance

Gold and silver exchange leading roles in the market quite often, especially on the short-term charts. Last time I wrote about it silver saved gold from collapse at the start of this month. The white metal unexpectedly bounced off the earlier low reversing the drop of the yellow metal.

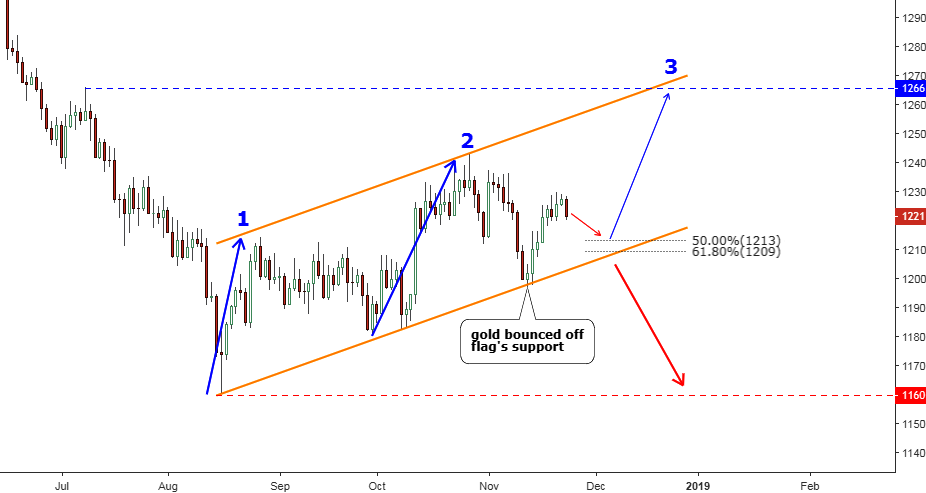
This time gold took the lead as its failure to break below the Bear Flag let silver lick its wounds and return above the $14 handle.

Both metals are still trapped in the middle of the range set by the earlier heavy drop, which first occurred in gold and then it was repeated in the silver market. In this post, I have focused on the local structure as the bigger picture remains unchanged.

Chart 1. Gold Daily: 3rd Leg Up Is Uncommon But Possible

consolidation
Chart courtesy of tradingview.com

The top metal couldn’t break below the trendline support of a Bear Flag (orange) and then quickly restored most of its losses coming back above $1200. It is interesting that the forecasted drop unfolded quite differently in each metal. Silver tagged the earlier trough, but gold failed even to breach the vertically sloped trendline. It looks like strong demand appeared right at the round number of the gold price in the $1200 area. Continue reading "Gold Extends Consolidation Giving Silver Another Chance"